As an experienced SEO, you are probably able to make the most out of the keyword report in Google Analytics
But that doesn’t mean just checking glamour metrics like Serp rankings on Google for your target keywords.
Of course, there is no harm in that, but your priority should be to analyze the keyword report in Google Analytics and identify the keywords that drive the most traffic.
And then track whether the people that land on these pages are converting or at least showing positive engagement.
A priority should be to find out whether your target keywords are driving traffic to the right pages on your website.
For this, Google Analytics is a key tool to explore which keywords are driving the most traffic to your site in granular detail.
Also, by setting up a custom report to track the behavior of people, you’ll be able to analyze your keyword performance for free!
The major problem with the keyword report in Google Analytics
When navigating to:
Acquisition | Overview | Organic Search
You will immediately notice a problem.
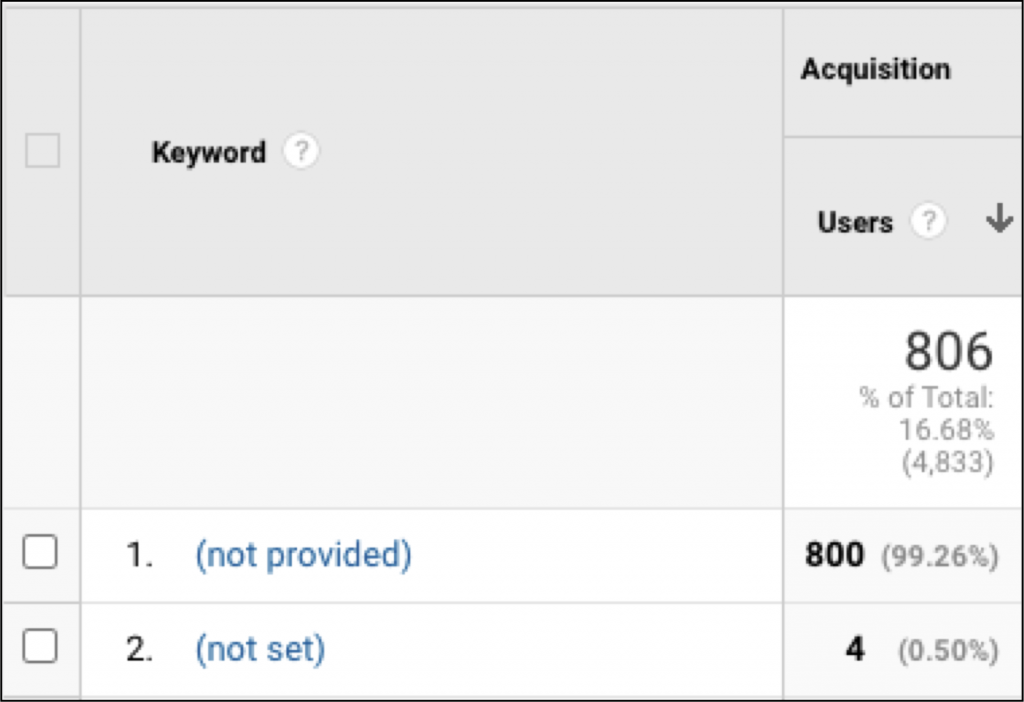
99% of the keywords in this report are marked as either (not provided) or (not set).
You can find out more about what this means in our beginner’s guide to ‘not provided’
In brief, it began in 2011, when Google introduced Secure Search to protect privacy.
As an alternative, the majority of people turned to Google Search Console to get these keywords back.
If you are stuck this is an okay workaround.
However, you will only see a fraction of the total keywords used by people to find your site.
So it makes it hard to analyze the keyword report in Google Analytics.
I wrote a detailed explanation of why GSC is not enough to bring back all of your search keywords.
Before you can measure keyword performance, you will need to get your keywords back in Google Analytics.
Your view should look like this:
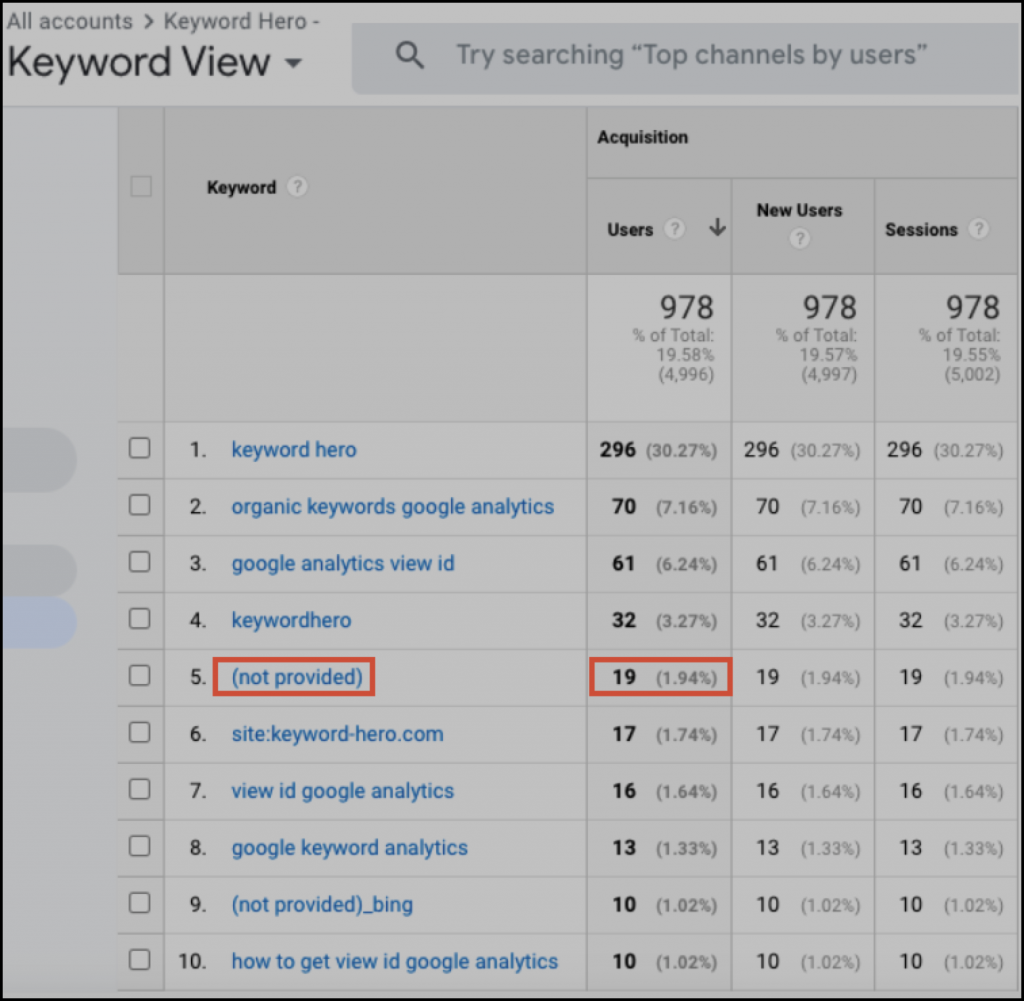
Hence, (not provided) is reduced to just 1.94% like it was for GA users back in 2011.
With Keyword Hero you can start tracking keyword conversions again with 83% certainty.
You can do the same in six simple steps:
Step 1: Click the banner above for a 90-day free trial of Keyword Hero
Step 2: Select the GA view that contains the domain
Step 3: Select a conversion or goal
Step 4: Connect the correct Search Console properties
Step 5: Create an upload account
Step 6: Select the right plan (all plans are free for 90 days)
This should take roughly two minutes to do.
Measuring keyword performance

1. Go to the keyword report in Google Analytics
As above you will find this at Acquisition | Overview | Organic Search.
(You should now see your keywords back in GA after creating an account with Keyword Hero, bear in mind that it could take a couple of days for the data to populate).
2. Select a time period to compare
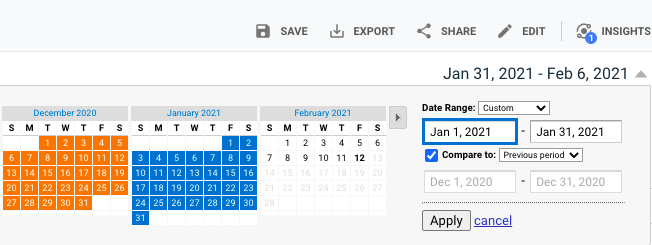
Generally comparing month to month makes sense here, as a weekly analysis might not have enough data.
3. Click on the pivot table button
![]()
Set the parameters to:
Primary Dimension: keyword, Pivot by: source, Pivot metrics: sessions.
You should have the following view.
(Note: I have added an advanced filter to only show the total here for legibility, you will see Google, Bing, DuckDuckGo etc.)
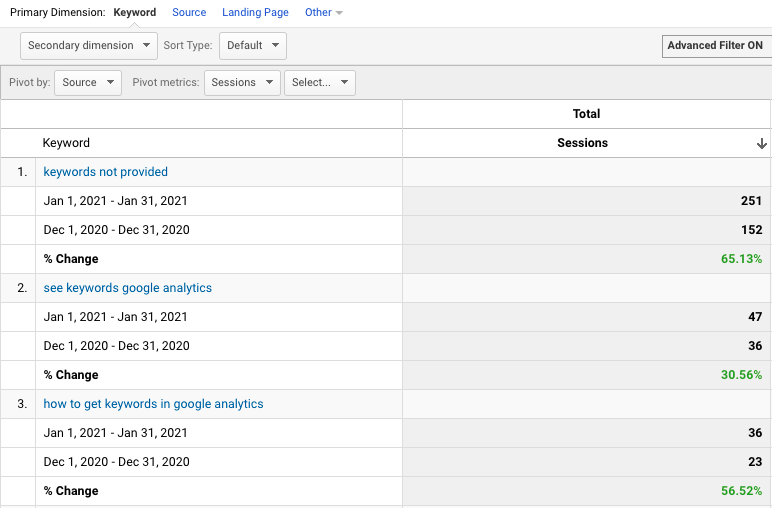
You will now see the change in session volume for each keyword for the two months in question.
For example, you can see that in January traffic for ‘keywords not provided’ increased 65.13% compared to the previous month.
This data was all previously hidden as (not provided).
Similarly, the traffic for the search term ‘see keyword google analytics’ increased 30.56%. With an increase for the long-tail keyword ‘how to get keywords in Google Analytics’ of 56.52%.
Now that you have a better idea of the keywords that are driving traffic to your website, you can go one step further and segment your data by branded keywords, non-branded keywords, or keywords that you want to push up in the Serps.
Once you have created an account with Keyword Hero you can also gain access to a custom filter view called Position, so you can see which keywords rank in which position in the Serps.
Ecommerce keyword report in Google Analytics
Let’s assume that you have previously set up ecommerce tracking.
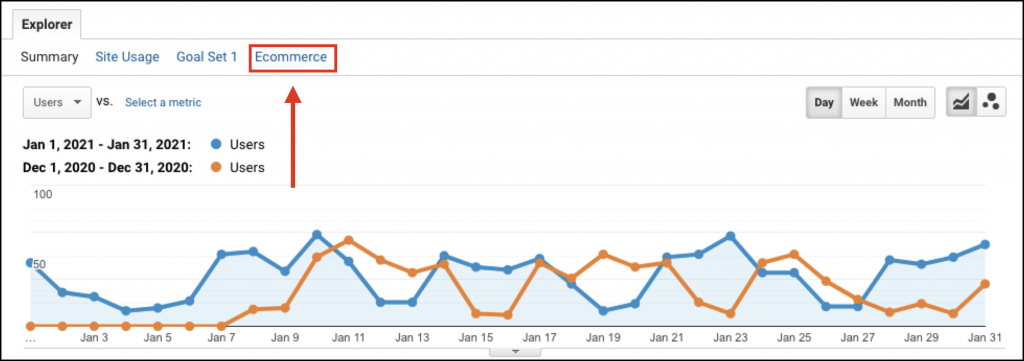
If you want to track the ecommerce performance of keywords, you can click on the Ecommerce tab on GA.
Now select ‘revenue’ for the Pivot metrics.
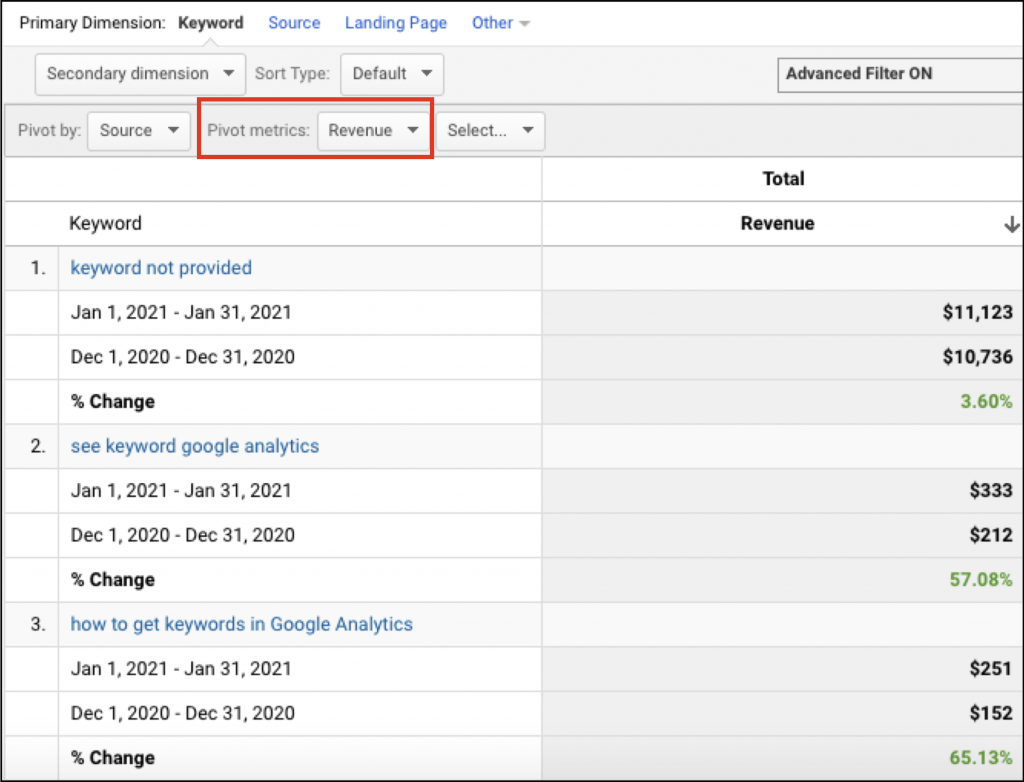
This view will allow you to compare revenue per keyword by month (or whatever period you decide).
You can filter by the highest month on month revenue increases to pinpoint your money keywords.
You might be surprised by the keywords that are earning the most revenue or have the highest conversion rates.
Keyword performance by landing page

Let’s take a look how to quickly track keyword performance for different landing pages.
The three metrics we want to look at are:
- New users
- Goal completions
- Goal conversion rate
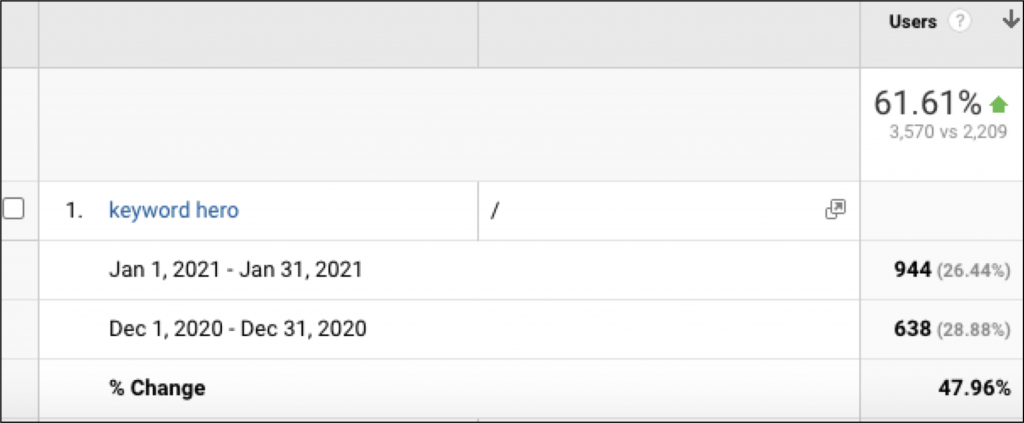
The aim of this analysis is to look at the landing page that is being served for each of your organic keywords and analyze the performance of each page.
For the vast majority of companies, branded keywords often perform the best, because the person is specifically looking for their company and is therefore more likely to convert than somebody who isn’t predisposed to your brand.
This is because they are more likely to be further down in the sales funnel, having already learned at least something about your business.
You would expect to see your branded keywords grow each month for the above metrics.
Engagement by keyword
The following four metrics will tell you how effective each landing page is.
- Unique page views
- Pages / session
- Avg. session duration
- Bounce rate
You may then want to analyze bounce rate by keyword. Landing pages related to keywords with high bounce rates may need to be revised, whilst keywords with high conversion rates may present an opportunity to target and drive more visitors that are more likely to convert once on the site.


