
Google Analytics has many effective ready-to-go reports, but the ability to import or create custom Google Analytics reports gives digital marketers a chance to boost traffic and drive conversions.
One brilliant feature of GA is being able to import custom reports that other Google users have created. The Solutions Gallery has dozens of custom reports and segments to deepen your use of Google Analytics and accelerate your learning curve.
These reports have benefits for both newbies and gurus, as they will help you learn more about your data.
I thought that it would be helpful if I shared some of the reports that I find useful.
After importing these custom Google Analytics reports you can tailor them according to your needs.
In this article, I will take you through seven custom Google Analytics reports that all marketers should equip themselves with.
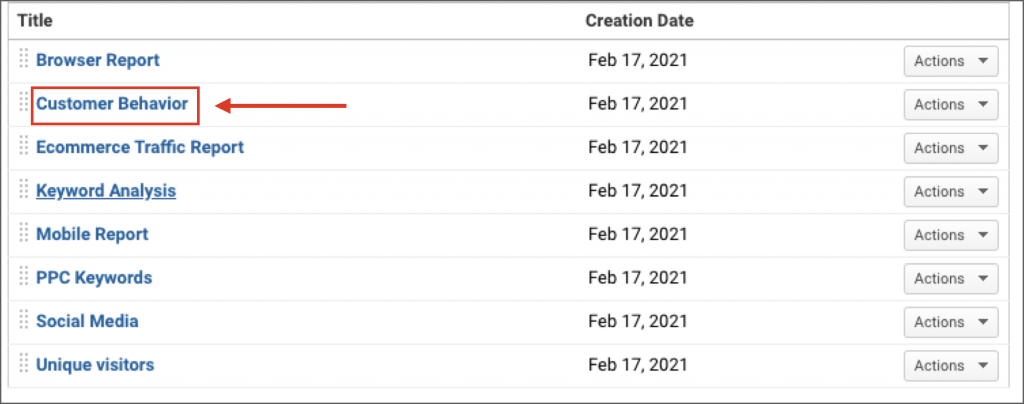
1. Customer Behavior report
The All-in-One-Digital Marketing report by Ullas Prabhakar is impressive.
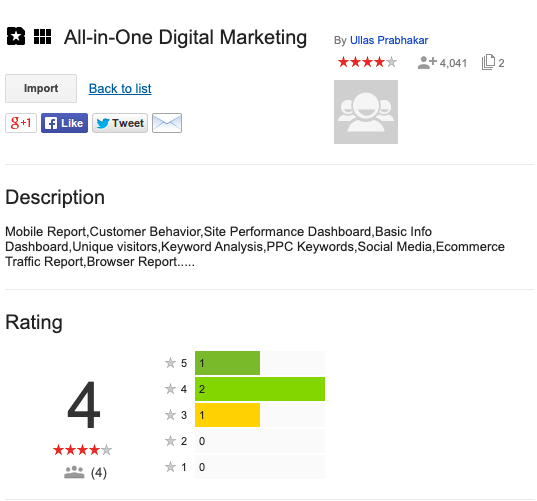
So far I have only checked out the customer behavior report, but I’m confident that the others are also worth a look. With over 4,000 imports it’s definitely a popular one for SEOs.
At a glance you can see the number of sessions, the percentage of new users and the bounce rate. You can view this by keyword once you have unlocked your (not provided) keywords.
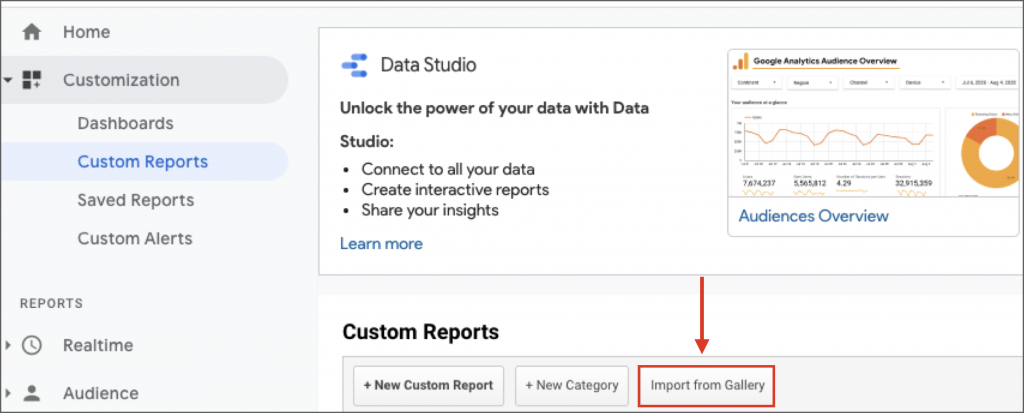
First navigate to Customization | Custom Reports | Import from Gallery.
With this custom Google Analytics report you can see how behaviour changes for new and returning customers along with their conversion patterns and event completions.
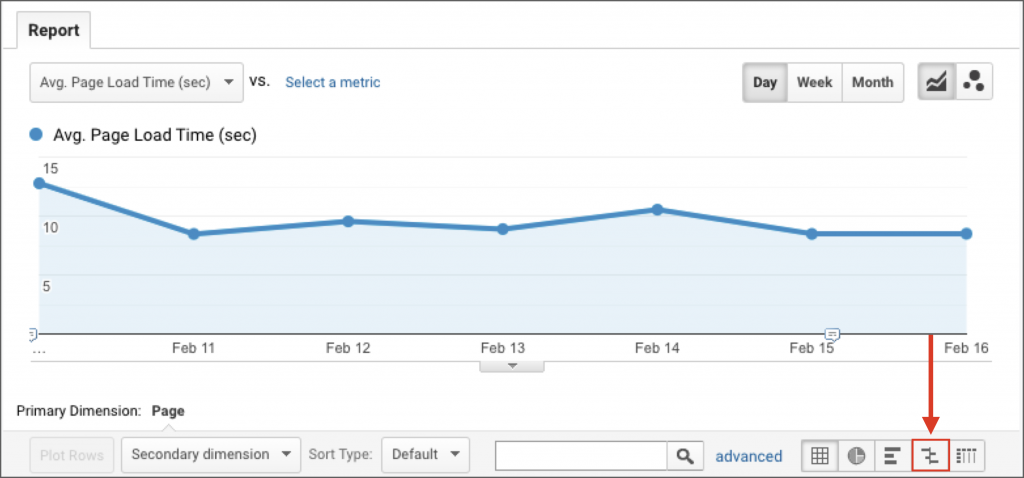
2. Page Timing report
Rachelle Maisner’s Page Timing report instantly reveals the problematic pages that need your attention. You can see which pages are too slow to load and have high bounce rates.
Speed is one of our nine part SEO priority list, and will become increasingly important as Google tries to improve the overall UX experience of the search process.
I recommend switching from the ‘data’ table view to the ‘comparison’ table view to compare load time to bounce rate. This allows you to view the bounce rate for each page against the site average.
If a page has an above average bounce rate it is likely that people are using a certain keyword to navigate there and the page content doesn’t match their intent.
3. Content Efficiency report
Avinash Kaushik, a household name in Google Analytics, created a custom Google Analytics report to focus on key metrics that will help you identify which content is performing the best and which need a little optimization.
It can help digital marketers pinpoint:
- What content is most engaging?
- What type of content (videos, case studies, images, reviews etc.) do visitors value most?
- What content delivers the most economic value?
Seeing exactly what type of content has the best ROI for keywords is an intelligent way to ensure that we are hitting the right notes with our content production.
4. Traffic Acquisition From Social Media report
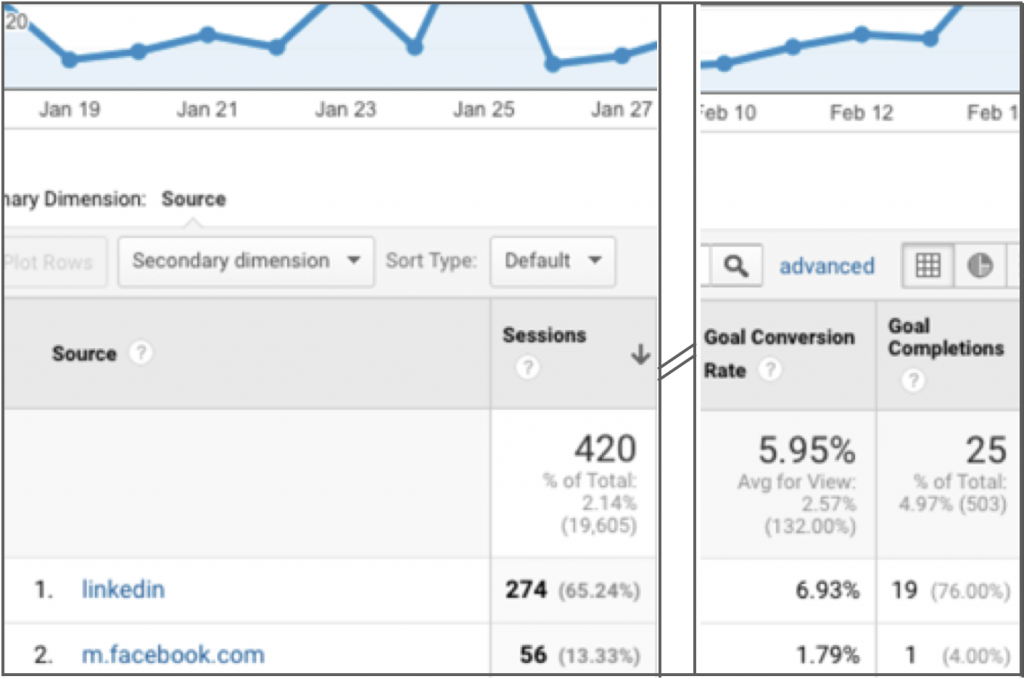
The Traffic Acquisition from Social Media report by Vagelis Varfis shows you which social media channels generate the most traffic for your site along with whether this traffic leads to goal conversions.
Metrics like Goal Conversion Rate and Goal Completions will tell you which social media sites you should pay more attention to. For most B2B companies it will be LinkedIn, but you will be surprised how effective Facebook and the other platforms can be for acquisitions.
5. Browser report
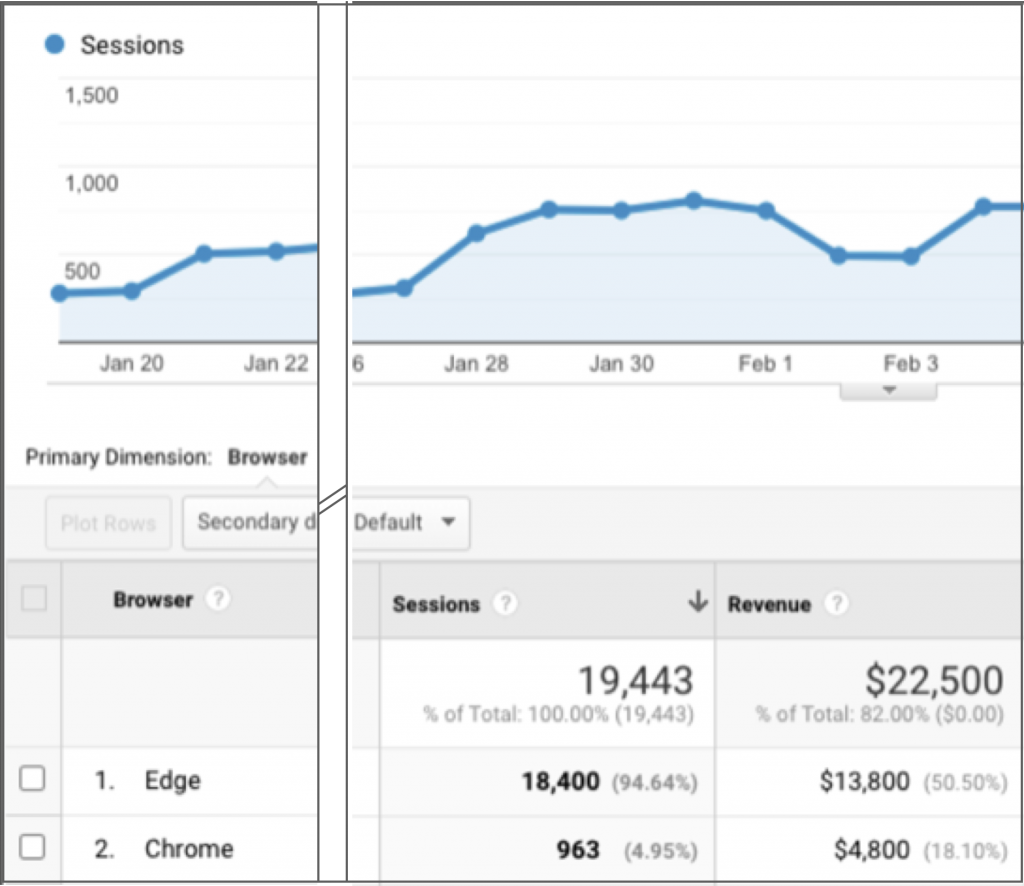
One of the most common website problems is incompatibility with different browsers. A custom Google Analytics report showing conversions per browser and segmented by device (mobile, desktop, tablet) is helpful in this regard.
This comes with the All-in-One-Digital Marketing report by Ullas Prabhakar.
If you’re not selling products on your site you can swap out Revenue and Unique Purchases for funnel conversion goals.
The browser report can provide unique insight into your customer profile.
Something to always remember with custom Google Analytics reports is that all data needs context and comparison. Don’t make rash decisions off one data set or graph viewed out of context. Understanding the full story takes comparisons across different tools and reports.
6. SEO Referring Pages report
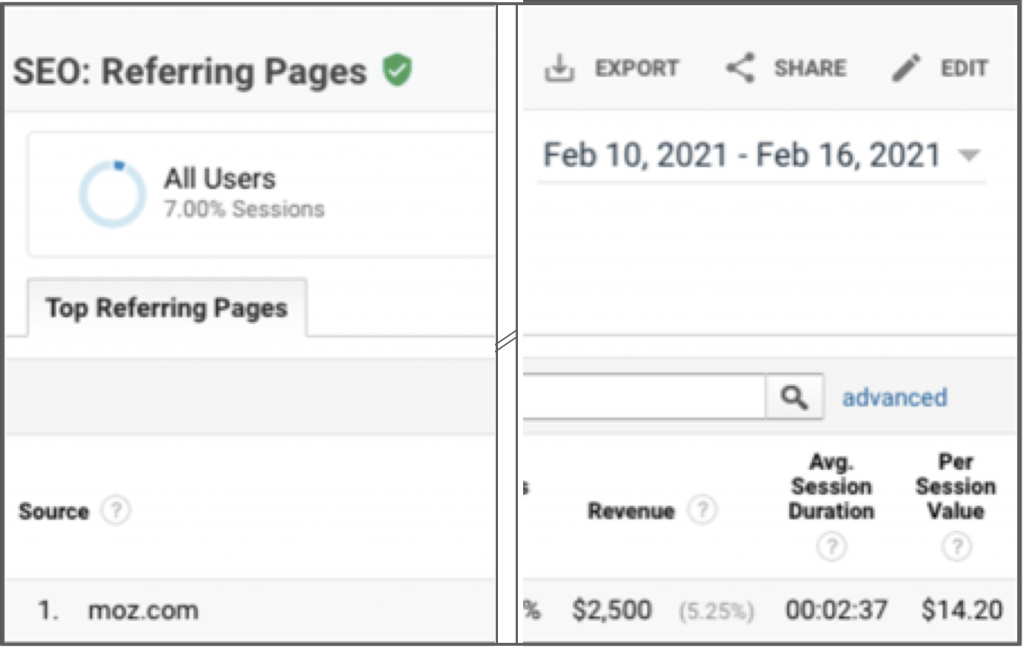
This custom Google Analytics report displays the effectiveness of your link building efforts allowing you to track the top referring links to your website. It comes bundled with a dozen other reports in the New Google Analytics User Starter bundle. You can deselect reports that you don’t need from this package.
The ‘Referral Path’ column will tell you exactly which page your links are coming from. Bounce Rate and Avg. Session Duration will indicate which of these links are high-quality, and Per Session Value will tell you which links are converting.
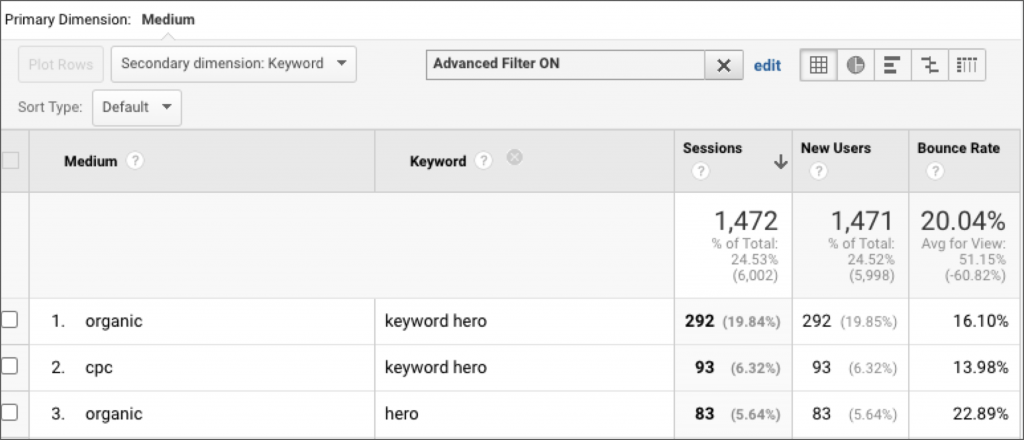
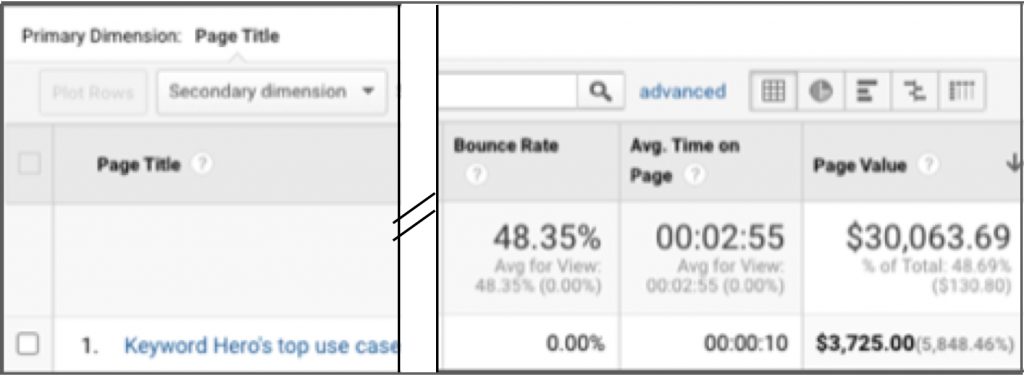
Keyword Hero Keyword Performance report
One of the handy reports that is not available through the gallery, but is an effective custom Google Analytics report is the Keyword Performance report.
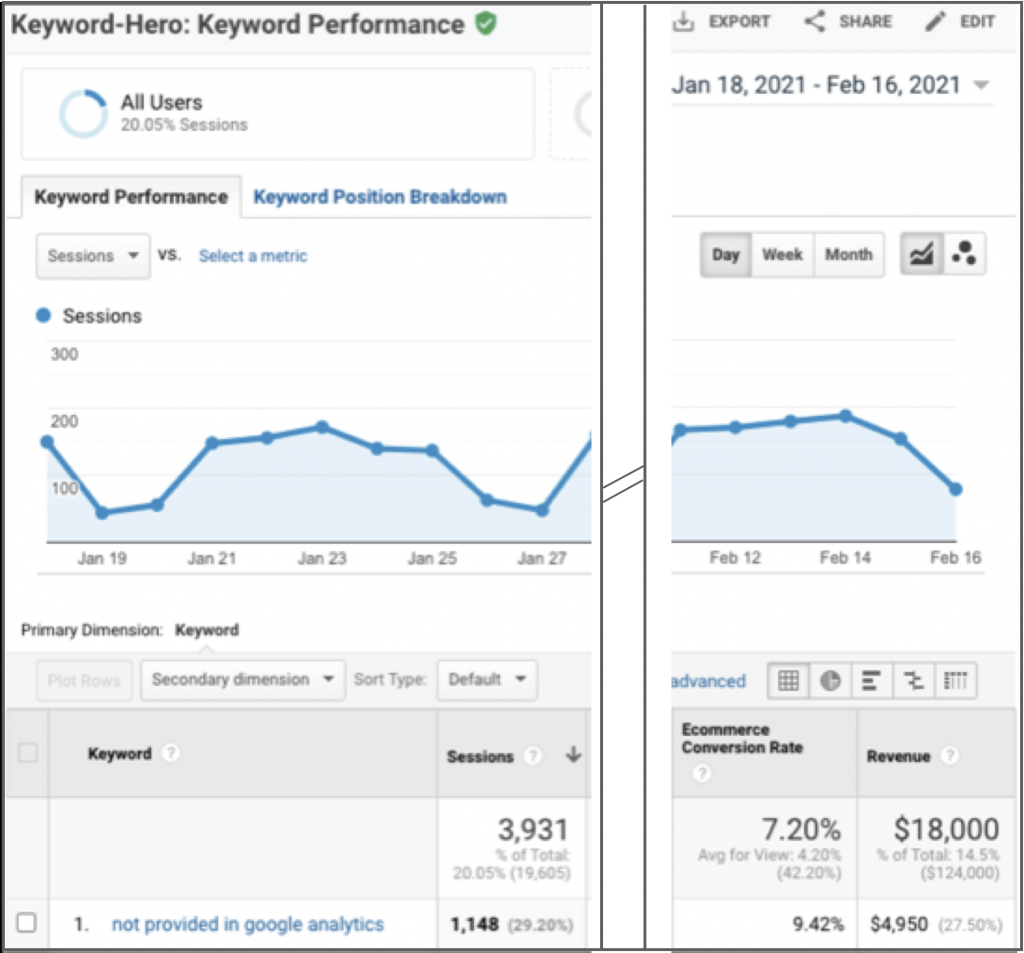
The Keyword Performance report gives you a snapshot of the performance for all of your top performing keywords. You’ll get insights about their average position in the Serps, the number of sessions and how users convert into revenue.
Seeing which keywords drive conversion and then learning how to track organic keyword conversions will allow you to enhance keyword optimization.
This requires that you first unblock (not provided) keywords.
How to create custom Google Analytics reports (step by step)
Creating custom Google Analytics reports that are tailored to your business is an option for more advanced users. Having said that it’s not complicated.
- Sign in to Google Analytics
- Click Customization | Custom Reports | + New Custom Report
- Choose a Title
- Click +add report tab (Optional)
- Select a report type: Explorer, Flat Table, or Map Overlay
- Define your dimension and metrics
- Click +add filter to limit the report to specific dimensions (Optional)
- Select the view where this report should appear
- Click save