
Digital marketers have a complex job justifying ROI for SEO to clients or leadership teams.
This is because the return is usually much harder to estimate than for paid marketing.
Yet, there is a formula that can help.
For this article, we will assume that you have some knowledge of ROI for SEO.
So we’ll jump straight into the main focus of this article.
ROI for SEO keywords
Calculating ROI for SEO is a struggle for even the most tenured SEO professional.
Yet, veterans of SEO have the advantage of keyword search volumes that provide insight into what people are interested in, information that is not available to new entrants.
Understanding the impact of SEO is essential, especially for SEO managers hoping to convince leadership that the investment is worthwhile.
However, as SEO is about earning visibility, not purchasing it, it makes SEO and ROI an unlikely pair.
Yet, there is a proven way to calculate SEO by keyword, which can help.
1. Keyword research
Most SEO operations begin with keyword research.
You can begin by accessing Google’s Keyword Planner if you have a Google Ads account.
All you need is the keywords you want to target and their respective search volume data.
Go to Tools and Settings, Planning, then Keyword Planner.
After entering a keyword search term, you will see the search volumes for each keyword.
On the right of the screen, you can download keyword ideas as a csv or directly in Google Sheets.
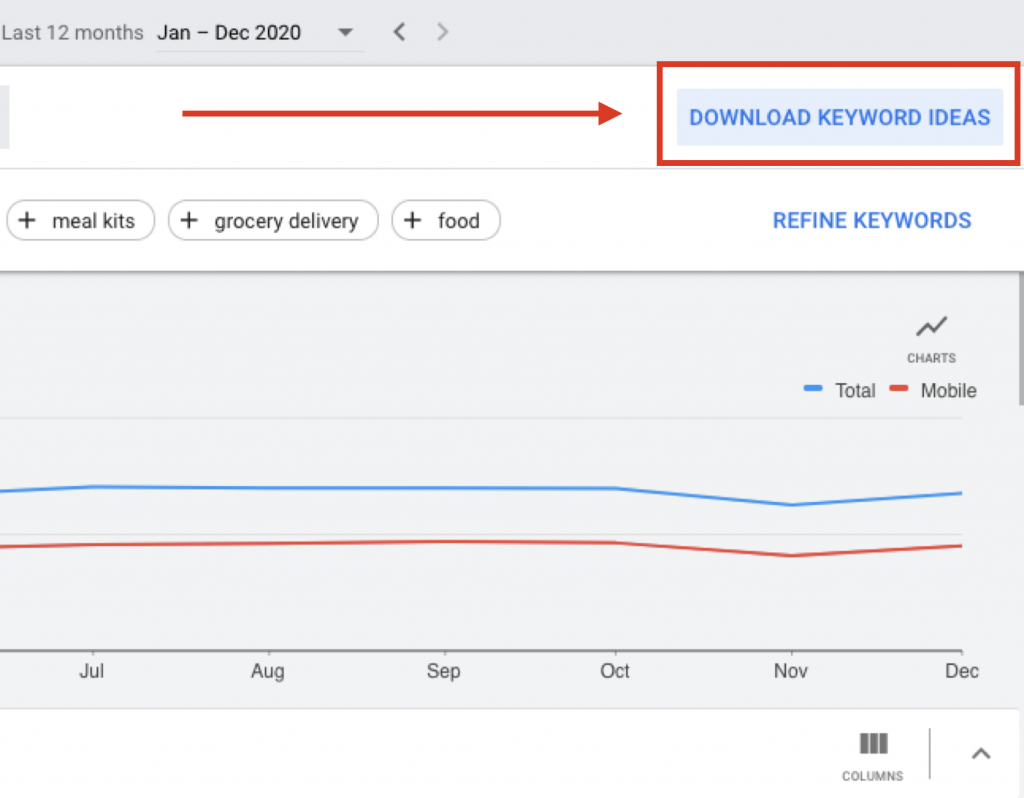
2. Download keyword Data
When you know what search terms you want to target, the next step is to calculate what the difference would be from your current performance against the expected improvement.
Let’s say I want to do a campaign that targets the search term ‘healthy food delivery’ or ‘healthy meal delivery’.
You want to compare the list of keyword search terms and estimated volume against what we are currently ranking for.
You want to see clicks, current impressions, click-through rate (CTR), and average position, as can be viewed under Performance in Google Search Console.
What you need to do is get 12 months of data for all keywords to get to that ROI for SEO.
If you have access to a tool that allows you to see keywords in google analytics your list will be more realistic.
Don’t just blindly choose keywords based on the generic volume numbers you extract from Google Keyword Planner.
Armed with a list of relevant keywords note down the total volume for these keywords.
3. Use realistic organic click-through-rate
Next, multiply the keyword volume by a realistic organic click-through rate for your industry and mobile/desktop.
It’s worth noting that the first result in Google’s organic search results has an average CTR of 31.7%.
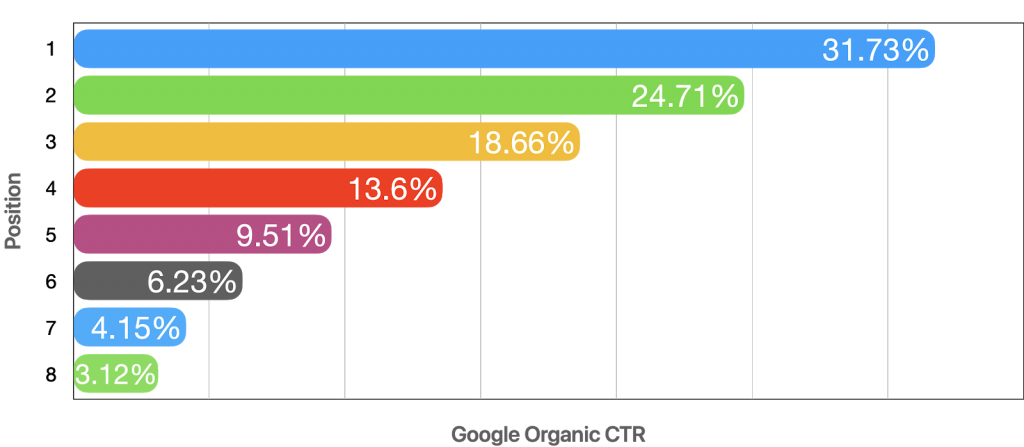
From position 9 onwards, CTR falls below 2.
By roughly predicting your potential traffic number (calculated below) you can multiply it by your average conversion rate for each product/ service type.
4. Estimate organic traffic for SEO ROI
First, identify current device percentage use by mobile and desktop via Google Analytics.
Get average desktop/ mobile search volumes from SEMrush or Ahrefs.
Alternatively, feel free to use your own estimations or use Rand Fishkin’s here.
Find your average CTR for the top five positions on Google Search Console.
You want to find out if you rank in the top five for a given set of search terms, and whether that presents an opportunity to invest resources.
To deepen our understanding, we can use other metrics such as average difficulty for a cluster of keywords.
5. Calculate target ranking position

Do this for desktop and mobile to use the relative CTR for each later on.
Pull the top keywords for the last 12 months from GSC into Google Sheets.
Round the position data to the nearest whole position and apply groupings (position 1, top 3, first page, etc.) for future analysis.
Use averageif excel formula (=averageif) on CTR for all top 10 positions (averageif pos = 1, averageif pos =2, etc.)
Average the top 5 position averages for a relative average, if you rank in the top 5 positions
(this % gets used in the final equation.)
6. Find device breakout for your current audience
From Google Analytics get the device traffic divided by mobile vs desktop.
You need these for the final equation.
Get desktop and mobile data for keywords, as available.
Keyword data can be for existing rankings (current market share/ footprint).
And/or for new terms you want to chase (gap footprint).
This data is available on an easy to scan dashboard here where previously not provided keywords are matched with Google Analytics sessions and broken out by device/ keyword.
Data needed = search volume and current ranking position (if pulling for current footprint).
7. Use formula for organic traffic
For organic CTRs, it makes sense to use 39% for mobile and 65% for desktop (feel free to tailor this to your own site preferences).
Traffic potential = ((mobile search volume*39%) * mobile traffic %) * avg T5 mobile CTR + ((desktop search volume * 65%) * desktop traffic %) * avg T5 desktop CTR.
This equation can be applied to every keyword you rank for, not in the top 5 (e.g. position 6-100).
This should give you insight into how an improvement in ranking position for a cluster of keywords will impact organic traffic.
You can then use this to compare against other metrics, like the difficulty to rank for a certain keyword.
8. Group keywords by conversion potential

It is better not to look at/ forecast on a per keyword basis, but instead certain topics, or all terms that reflect the current footprint for your site.
By clustering, you get a better understanding of the topic opportunity and risk/ rewards; when looking at keyword difficulty and revenue opportunity.
Google Search Console has limitations, for performing keyword research, however, its ok for assessing your presence in search results.
Remember that Google Search Console provides keyword data for your site as a whole, and not for individual pages.
Performance data from GSC is a measure of what’s happening on Google itself, and not necessarily what is happening on your site.
However, as you introduce more specificity into how you review a website, the precision of the data reported in Google Search Console increases.
Hence, if you add hundreds of subdirectories to GSC, the increase in data precision can be valuable to draw the curtain on analytics not provided.
Like any single source data point, it needs to be combined with others to verify its validity.
For instance, to unlock keywords not provided we pull together nine different data sources.
You can read about it in more detail here.
But for a general overview of your keyword performance, GSC can be a helpful starting point.
To drill down to the exact keywords people use to find specific pages on your site, and to learn how to better match search intent, there are more sophisticated tools on the market.