HERO’S DASHBOARDS
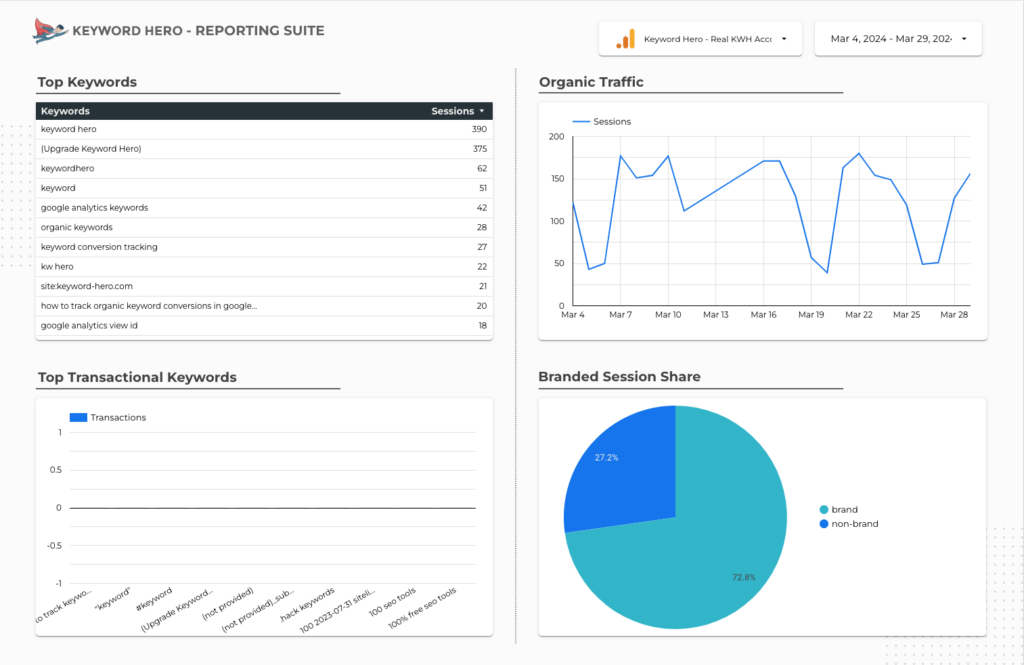
The Hero developed custom dashboards that are optimized to give you insights into your keyword data.
Add the dashboards to your Keyword Hero property in GA by clicking “GET IT!” and make sure to do this first and use Chrome if it doesn’t work!

KEYWORD HERO GOOGLE DATA STUDIO REPORT
ATTENTION: Before you use our Google Data Studio template, please read our connection guide: “Using Hero’s Google Data Studio Report“.
Our Google Data Studio Report gives you a all in one overview of your most important SEO KPIs
● SEO Dashboard ● Mobile vs. Desktop ● Keyword Performance ● Device Performance ● Country Performance
● Band vs. No Brand ● Mobile Keywords ● Quick Win Keywords ● Keyword Performance by Position ● Keyword to Landingpage
SEO DASHBOARD
ATTENTION: You need the metric “average position” for this. Set it up in 30s.
The SEO dashboard gives you a quick overview of five of your most important SEO KPIs, such as your top keywords and their position in the SERPs, your organic performance across channels and countries.
MOBILE VS. DESKTOP
ATTENTION: You need the metric “average position” for this. Set it up in 30s.
Monitor and optimize your mobile and desktop Performance by always having a eye on both of them. This dashboard will give you a quick overview of the organic performance across the two device categories.
KEYWORD PERFORMANCE
ATTENTION: You need the metric “average position” for this. Set it up in 30s.

The keyword performance report gives you a quick overview of the performance of individual keywords. You’ll get insights about their position in the SERPs, the the number sessions they trigger and how users behave that use those keywords.
DEVICE PERFORMANCE
ATTENTION: You need the metric “average position” for this. Set it up in 30s.
Get a clear picture about the performance across device categories. This dashboard gives you insights about what devices are used by organic users and how they behave depending on what they used.
COUNTRY PERFORMANCE
ATTENTION: You need the metric “average position” for this. Set it up in 30s.
You’re getting clients from all over the world? Then this is your custom dashboard! Analyze your SEO performance and keyword ranking across various countries at one glance.
BRAND VS NON-BRAND
ATTENTION: You need the metric “average position” for this. Set it up in 30s.
The brand / non-brand keyword performance report enables you to see at one glance how many sessions and transactions came from generic search queries vs those containing your brand name. You’ll have an easy time to measure your SEO efforts compared to brand building campaigns such as TV or print.
MOBILE KEYWORDS
ATTENTION: You need the metric “average position” for this. Set it up in 30s.
Focus on your mobile traffic! With Google’s Mobile Index coming, this dashboard helps find mobile winner and loser keywords. Use additional dimensions and segments to dive deep into your users’ behaviour.
QUICK WIN KEYWORDS
ATTENTION: You need the metric “average position” for this. Set it up in 30s.
What are those keywords that already drive traffic but are still on Google’s 2nd page? Our Quick Win Keyword report shows you all those keywords that are close to ranking on the first page. Putting more effort into those will increase your traffic tenfold fold.
PERFORMANCE BY POSITION
Do users that clicked on SERP position 1 behave differently than those clicking on 8? This dashboard answers this for you and gives you a good insight into how position and traffic correlate.
KEYWORD TO LP
ATTENTION: You need the metric “average position” for this. Set it up in 30s.
Which keywords does your landing page rank for? The keyword to landing page report correlates those two dimensions. This helps you to spot under- and top performing keywords for each landing page.
Setup “Average Position”
For some of those reports and dashboards you need the calculated metric “average position”. We can’t create it through the API, so you need to do it manually. It’s literally 30 seconds:
- Go to “Admin” in your Google Analytics account.
- Select the Keyword Hero Property
- Select “Calculated Metrics” in the “View” column on the right
- Select “+ Add Calculated Metrics”
- Choose”Avg-Position” as name and enter “{{Position}} / {{Sessions}}” into the Formula box
(ATTENTION: {{Sessions}} must be written in the language of your GA account, i.e. in German {{Sitzungen}})
