
Did you know that over 25% of people click the first Google search result?
The click-through rate drops to 2.5% for the tenth position on Google, thus it’s incontrovertible how crucial SEO is for businesses of all sizes.
So, what are SEOs doing to claim the top-tier Serp positions?
One of the complexities of SEO is that no one business is the same. And what works for one business might not work for another.
Hence, the need to measure SEO performance, update, rethink, and redeploy based on the latest analysis.
The best way to do this is by tracking website metrics in Google Analytics.
What is SEO Analytics?

Before taking a look at how Google Analytics can help you monitor and improve SEO performance, let’s start with the basics.
SEO analytics is defined as the process of collecting, tracking, and analyzing website data to build a website’s organic traffic and to increase conversions.
This is important as it allows you to identify opportunities, gain a deeper understanding of your users, and improve ROI for SEO.
Luckily, there are dozens of SEO analytics’ tools available to measure SEO data. One of which is Google Analytics. And once you get comfortable with the tool you can use it to present your insight to your team or clients.
How does using Google Analytics for SEO work?

Google Analytics contains important data that your business can use to track and enhance your organic search initiatives, from keywords (once they are unlocked) to your website’s top referrals and key behavioral metrics like time-on-page and conversion rates.
Without analytics, SEO would involve a lot of guesswork, with analytics, every decision you make is evidence-based. Does a landing page need to be updated? Check the data. Is it worth publishing an article on a third-party website? Check the data.
Here are 21 use cases for using Google Analytics for SEO split by beginners, intermediate and advanced.
1. Real-time reporting
The Google Analytics’ real-time reporting feature allows you to monitor your website in real-time. This will let you view your live website traffic, the pages which are currently attracting customers, and where they arrived from.
You can also measure your campaigns, events, social media posts’ performance and if they’re driving traffic to your website or not.
There are six reports in real-time reporting:
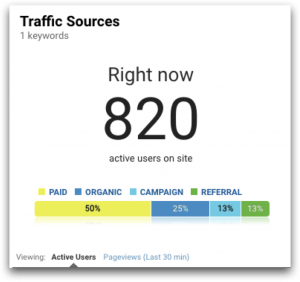
Overview: At a glance see the number of active users, top referrals, top social traffic, and top keywords.
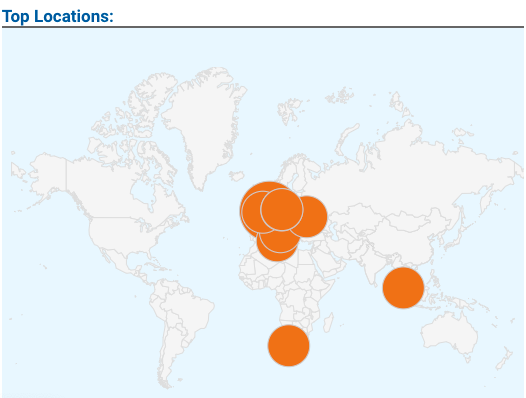
Locations: This lets you see the location of active users; particularly important if you are running an event or campaign and you want to judge whether you are attracting enough traffic or whether you need to run more Google Ads and increase social media promotion.
Traffic Source: This tells you quickly the split between direct, paid, and organic traffic. Again this is important during campaigns to get the right mix of paid versus organic traffic.
Content: This report shows you what pages people are browsing and whether they are on mobile or desktop.
Events: Events are user interactions with content that can be measured independently from a web page or a screen load. Downloads, mobile ad clicks, gadgets, flash elements, scrolling, and video plays are all examples of actions you might want to measure as events.
Conversions: Shows you where active users are in your sales funnel, along with goal hits per minute and second.
Useful ways to use Real-Time
- Monitor whether new and changed content on your site is being viewed
- Understand usage of your mobile app through event tracking
- See whether a promotion is driving traffic to your site or app, and which pages these users are viewing
- Monitor the immediate effects on traffic from a blog / social network post or tweet
- Verify that the tracking code is working on your site or app
- Monitor goal completions as you test changes to your site
The usefulness of these features is not limited to just marketers and analysts. IT departments, customer service, and various other departments can use these reports to their advantage.
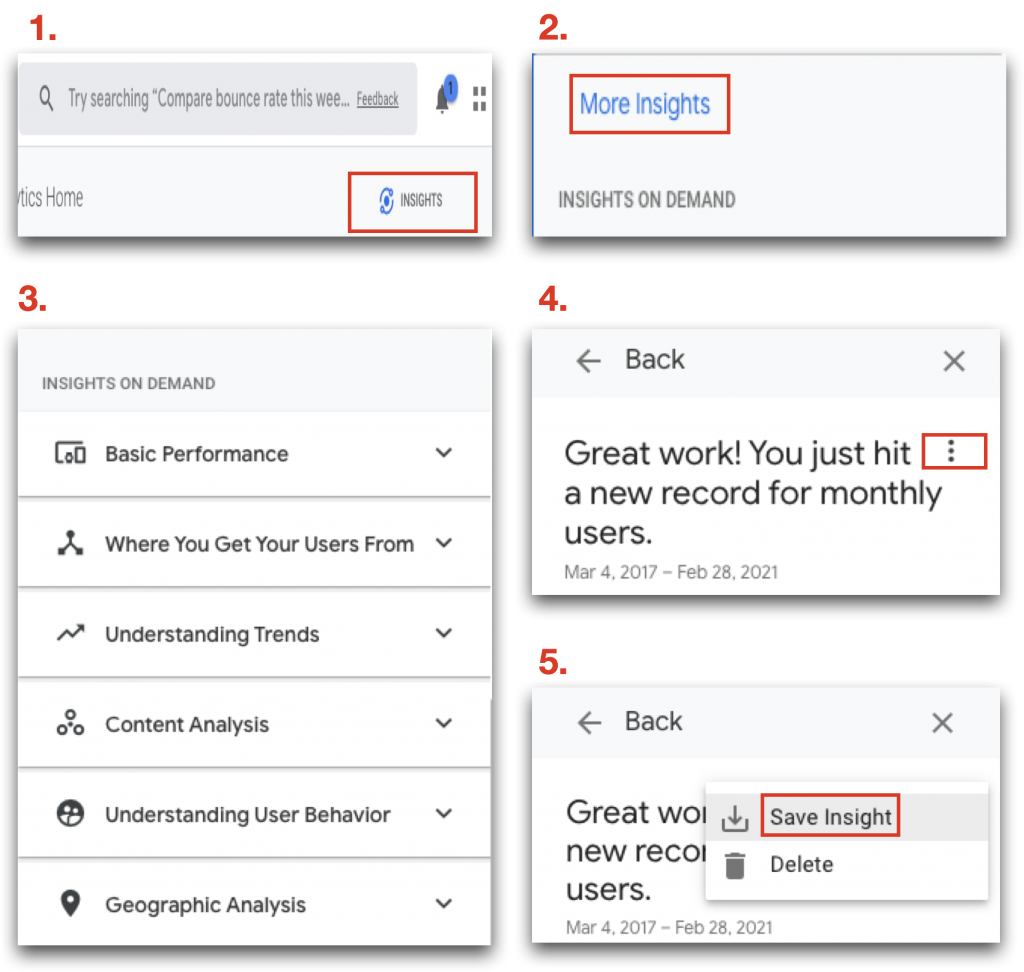
2. Insights report
Google Analytics helps you explore behavioral metrics and locate specific data points. For example, you want to find out where your most engaged audience is referred to from, or you want to understand behavior in different user segments? Google Analytics allows you to do that.
The Google Analytics Insights report lets you see your metrics as a snapshot. Follow the five steps below to choose an insights report and save it to quickly scan metrics, trends, over defined time periods.
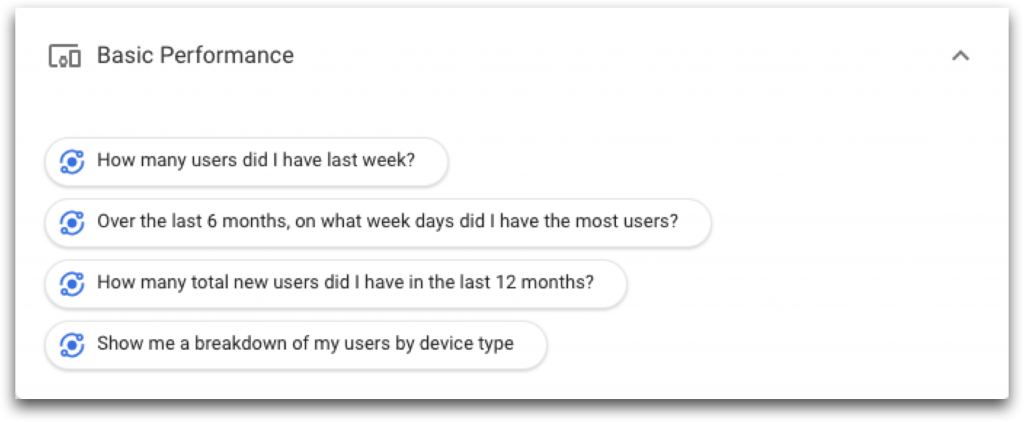
Here are some basic performance questions to get you started:
3. Landing page bounce rates
Different bounce rate reports can give you information about whether people interacted with a page on your website or if they left without initiating another action (navigated to another page, or scrolled down).
If you navigate to Acquisitions | Overview| Organic Search.
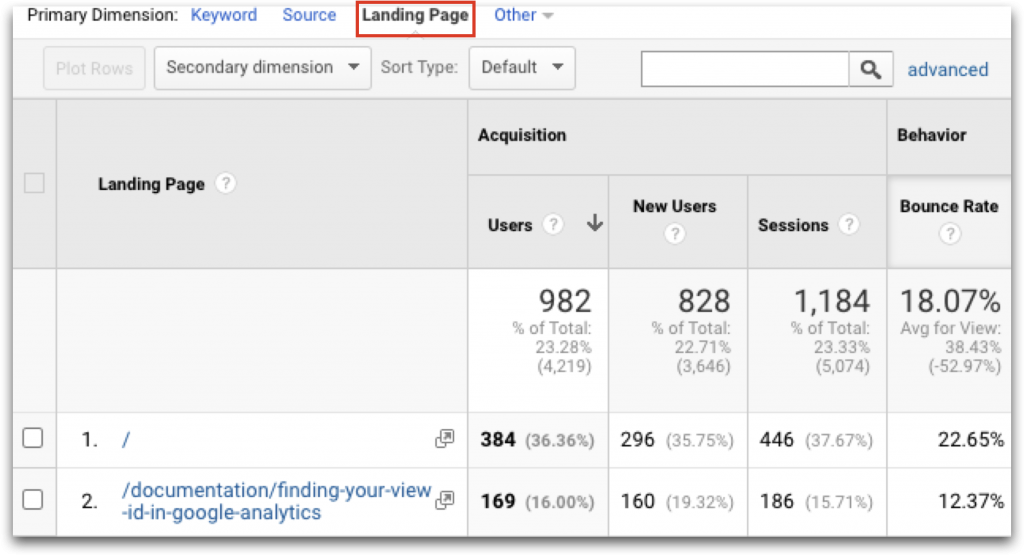
And tab over to Landing Page. Next sort the report by the bounce rate column and you can quickly identify what pages have the highest bounce rates. If the bounce rate for a page is north of 40% there may be an issue with how it’s configured.
Having a high bounce rate means that visitors land on your website but don’t like what they see. High bounce rates can be caused by poor site design, slow page load time, content that doesn’t match intent, or a misleading Serp title or article description.
Is a high bounce rate always a bad thing?
Not necessarily.
If the success of your website depends on people viewing more than one page you need to fix it. Let’s say your homepage acts as a springboard to the rest of your site (e.g., product pages or a checkout process) and a high percentage of people are viewing only your home page, then a high bounce rate is alarming.
In contrast, if you have a single-page site like a blog, then a high bounce rate is ok.
Examine your bounce rate from different perspectives. For example:
- The Audience Overview report provides the overall bounce rate for your site
- The Channels report provides the bounce rate for each channel grouping
- The All Traffic report provides the bounce rate for each source / medium pair
- The All Pages report provides the bounce rate for individual pages
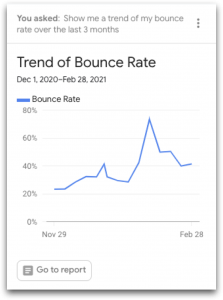
You can also find the report: ‘Show me a trend of bounce rates over the last 90 days,’ in the Insights section above.
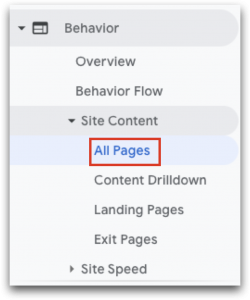
4. Session duration bucket
How long a user spends on a page can tell you how engaged they are with the content.
If you navigate to Behavior | Site Content | All Pages.
Then tab across to Page Title you can see how long each user spent on a single page.
Average session duration should be on every SEO priority list as it tells a story of user engagement by reporting how long users stay on a specific landing page.
This is a good tool for evaluating whether page content matches search intent, and if your page fails to match up, Google will derank your page for that particular search query, assuming that it doesn’t match up with the expectation of search engine users.
5. Understand website visitors
The Percent of New Sessions report shows the average percentage of first-time visits to your site.
This metric measures how many of your site visits are from first-time visitors or returning visitors, and is an indicator of marketing performance for new acquisitions. This is an important KPI to measure the ‘stickiness’ of your site, or whether your site has enough of a pull factor for multiple visits.
What is an appropriate target percentage for new sessions?
We’ve seen a range between 40 and 80%, but the 80/20 rule is a common split to strive for.
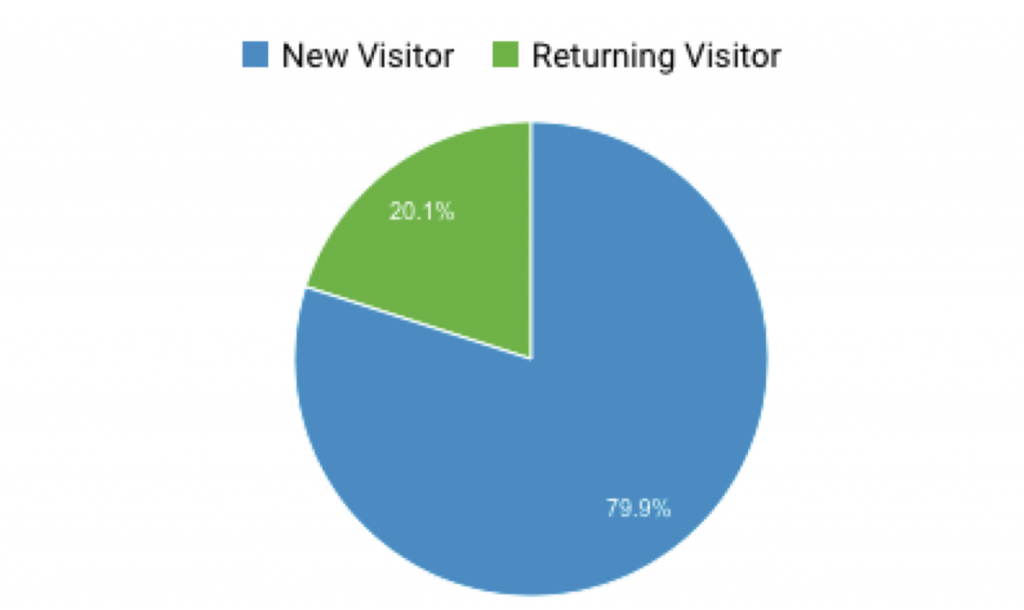
A good site will have a mix of new and returning site visitors, and this mix will vary depending on your site goals, business, and industry. If your goal is to generate leads from your site, you’ll want a higher percentage of returning visits as it often takes multiple interactions with your site for users to convert.
6. Set up views with filters
Use filters to limit or modify the data in a view. For example, you can use filters to exclude traffic from certain IP addresses, include only data from specific subdomains or directories, or convert dynamic page Urls to readable text strings.
To create a filter at the account level:
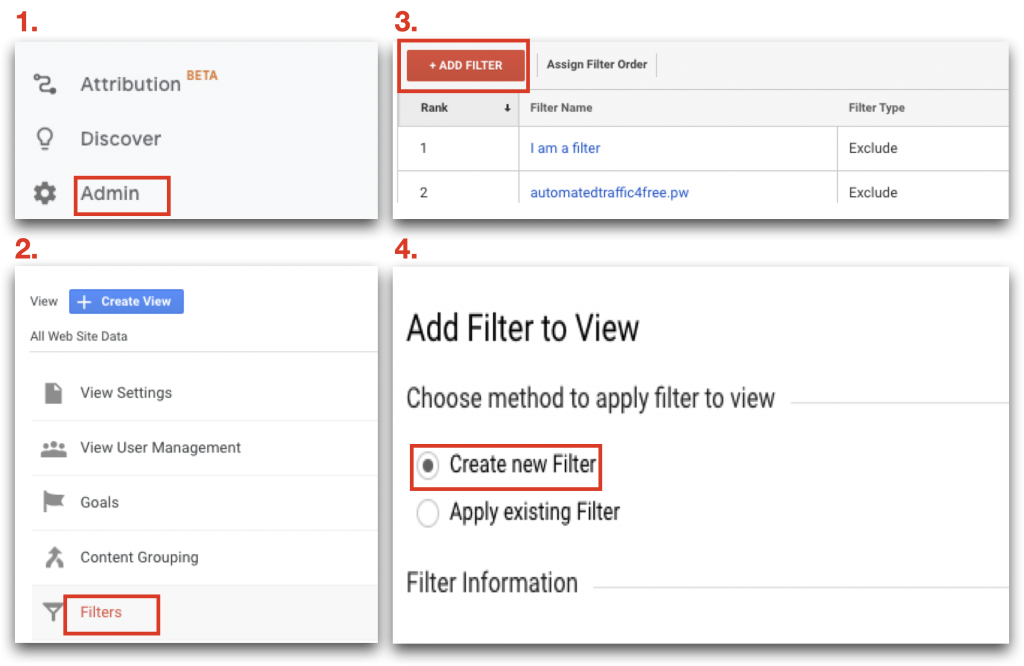
- Sign in to Google Analytics
- Click Admin, and then move to the account where you want to create the filter
- In the Account column, click All Filters
- Click + Add Filter (If this button is not visible, you do not have the necessary permission)
- Enter a name for the filter
- Select Predefined to select from the predefined filter types
- Select Custom to build a custom filter from the options provided
- From the Available views list, select the views to which you want to apply the filter, then click Add
- Click Save
- By default, view filters are applied to the data in the order in which the filters were added So, if there are existing filters for a view, your new filter is applied after them
Why should I use filters?
Here are some of the ways you can use filters:
Exclude internal traffic from your reports
If you’d like to exclude internal traffic from your reports (such as traffic from your company intranet), you can set up a filter that identifies all of the IP addresses you’d like to exclude.
Report on activity in specific directories
- If you want to report on activity in only a specific directory, you can set up an Include filter that identifies only that directory
- If you want to report on activity in all but a specific directory, set up an Exclude filter that identifies only that directory
Track subdomains in separate views
If you want to track both www.example.com and help.example.com, you can create a separate view for each one, and use an Include filter to identify only the specified subdirectory.
7. Create a dashboard
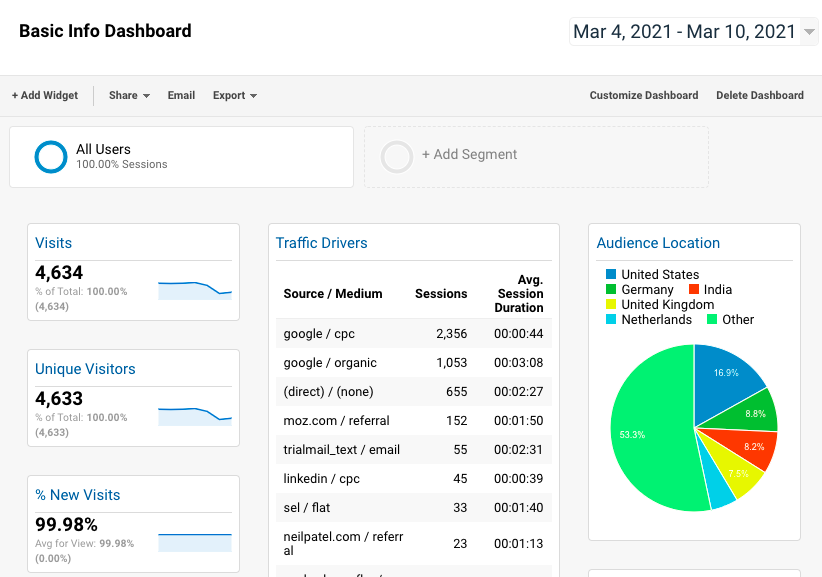
Dashboards allow you to see your most important reports at a glance. Dashboards are a collection of widgets that give you an overview of the reports and metrics you use most often.
They let you monitor many metrics at once, so you can quickly check your accounts or observe correlations between different reports. Dashboards are easy to create, customize and share.
Every view in Analytics comes with a default My Dashboard. While the default dashboard may suffice, the real usefulness of dashboards lies in your ability to create and customize them the way you want.
Dashboards contain one or more widgets (up to 12 per dashboard) that give you an overview of the most important dimensions and metrics.
To create a new dashboard:
- Sign in to Google Analytics
- Navigate to your view
- Open Reports
- Click Customization | Dashboards
- Click Create
Adding widgets to your dashboard:
A dashboard can have one or more instances of the following kinds of widgets:
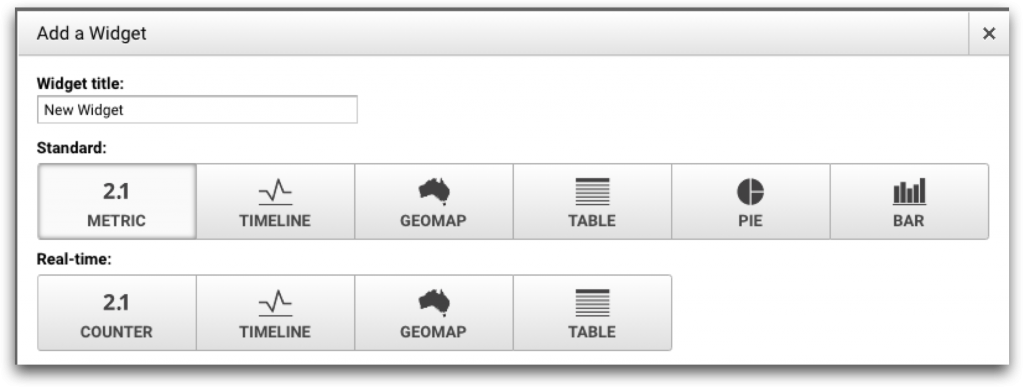
Metric
Displays a simple numeric representation of a single selected metric.
Timeline
Displays a graph of the selected metric over time. You can compare this to a secondary metric.
Geomap
Displays a map of the selected region, with the specified metric plotted on the map. Hover over the map to see the actual metric values.
Table
Displays up to two metrics describing the selected dimension in tabular format.
Pie
Displays a pie chart of the selected metric grouped by a dimension. Hover over a slice to see the specific metric values.
Bar
Displays a bar chart of the selected metric grouped by up to two dimensions. Mouse over a bar to see the specific metric values.
8 Use cases for intermediate users
If you have been using Google Analytics for a while and are familiar with the basic functions you will want to dive deeper into more advanced features.
1. Set up goals
Intermediate users can apply goals to measure how often site visitors complete specific actions.
Goals measure how well your site or app fulfills target objectives. A goal represents a completed activity, called a conversion, that contributes to the success of your business.
Examples of goals include ‘add to cart’ (for an ecommerce site), completing a game level (for a mobile gaming app), or subscribing to a newsletter (for a marketing or lead generation site).
Defining goals is a key component of using Google Analytics for SEO. Once you have created some goals you can view the number of conversions and the conversion rate for your site or app. Without this information, it’s almost impossible to evaluate the effectiveness of your online business and marketing campaigns.
How to create a new goal?
- Sign in to Google Analytics
- Click Admin, and navigate to the desired view
- In the View column, click Goals
- Click + NEW GOAL or Import from Gallery to create a new goal, or click an existing goal to edit its configuration
You can select a goal from a template, a custom goal, or a smart goal.
2. Ecommerce transactions
To track transactions, you will need to add an ecommerce tracking code to your shopping cart. This allows Analytics to calculate the revenue and ROI metrics from purchases on your site.
First, you need to enable ecommerce for each view in which you want to see the data.
- Sign in to Google Analytics.
- Click Admin, and navigate to the view you want.
- In the view column, click Ecommerce Settings.
- Set Enable Ecommerce to ON.
- Click Save
Then use Google Tag Manager to manage your tracking code.
Read the set-up guide for Ecommerce Tracking.
It’s often useful to also create a destination goal to signal the completion of an ecommerce transaction. Setting up a destination goal will allow you to check the percentage of sessions that resulted in at least one transaction.
If you set up a destination goal to signal the completion of an ecommerce transaction, leave the goal value field blank. The actual value of the transaction will appear in the Revenue metric (not the Goal Value metric) and will come from the ecommerce tracking code in your shopping cart.
Once you have defined ecommerce tracking and can verify that the transaction data is being sent to Analytics, configure your destination goal as follows:
For destination: Supply the Url for your “purchase confirmed” page. For example http://www.everythingisforsale.com/mysite/myCart_receipt_.asp
Match Type: Begins with is the best choice for shopping pages since shopping cart Urls often have many parameters to the end of the Url to pass data to the ecommerce server. You can test your shopping cart to determine the structure of the Url and match it accordingly.
Goal Value: If you’re tracking an ecommerce transaction, you can leave this blank. Use the Revenue in your ecommerce reports to see how much an action is worth.
Read more about how to analyze enhanced ecommerce data.
3. Use attribution modeling
Attribution modeling is central to mobile measurement. It is important for advertisers to determine which of their traffic sources deliver value (and which are the best performing).
Without an attribution model in place, an advertiser can’t know where traffic is coming from, at what volume level, from which sources and how much is needed to pay for it, and whether it delivers a long-term return.
With modeling in place, advertisers can assign credit and responsibility to users from different channels. This helps the advertiser to analyze the quality of incoming traffic and make decisions about using those channels in the future.
Which attribution model should I use?
That depends on your business and advertising objectives. I recommend using the Last Touch attribution model when there is a low level of buying consideration. In contrast, companies who value brand building and awareness will want to select the First Touch attribution model.
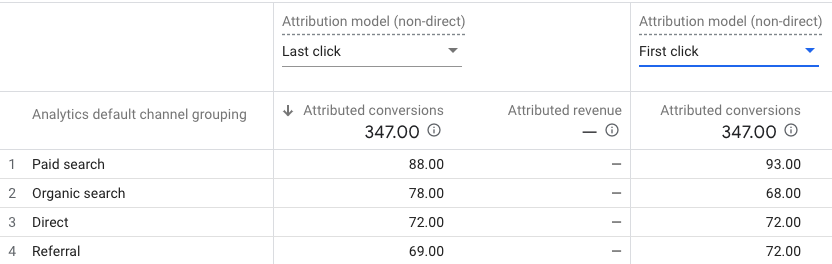
Google Analytics often attributes direct sessions (ie. those that are started by entering the Url / domain in the browser) to indirect channels, such as search. This happens when the user originally came from an indirect channel and returns through a direct session with the same GA cookie, which expires only after 180 days.
This may result in a distorted representation of traffic, especially for SaaS tools. Think of a user that discovered the software through search and goes back to the site every day for one month through direct sessions:
GA attributes: Search = 30 sessions; direct = 0 sessions.
The last click model attributes: Search = 1 session; direct = 29 sessions.
In many cases, there are companies where more than 50% of the organic sessions are direct sessions. The same is true for paid search.
The last direct click attribution model attributes to whatever channel the session originated from and doesn’t take any history of the user into account. If you are interested in your SEO performance, I recommend using it. It gives you a much clearer picture of where traffic comes from.
4. Custom dimensions
Custom dimensions are among the most powerful features of Google Analytics for SEO. They allow intermediate GA users to see in-depth insights about users & websites.
A dimension can be anything related to the website:
- City
- Device
- Traffic source
- Search term
- Count of session
- Browser
- Demographics
By default, there are around 100+ default dimensions available in Google Analytics.
You can set up custom dimensions via the following methods:
- Google Tag Manager
- Google Analytics (gtag.js or analytics.js)
- Google Analytics Data Import
Google has a step-by-step guide to setting up user-level scope custom dimensions.
Once you are up and running here is an example of what you could do.
Purchasers / Leads (user-level scope)
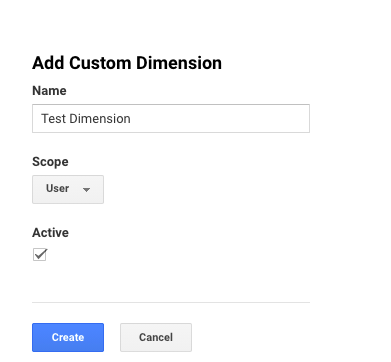
Once someone purchases your product or submits a lead, you can put the users in the most recent purchase value bucket as:
- $1 – $500
- $500 – $1000
- $1000 – $5000
- $5000+
So when someone transacts within the $500 – $1000 range, it will send the custom dimension value as “$500 – $1000” and so on.
You can do the same with leads & assign a lead value bucket.
5. Event tracking
Events are people interacting with content that can be measured separately from a web page or a screen load. Downloads, mobile ad clicks, video plays are all examples of actions you might want to measure as Events.
Here is an example.
The following command sends an event to Google Analytics indicating that a summer campaign promotional video was played:
ga(‘send’, ‘event’, ‘videos’, ‘play’, ‘summer campaign’);
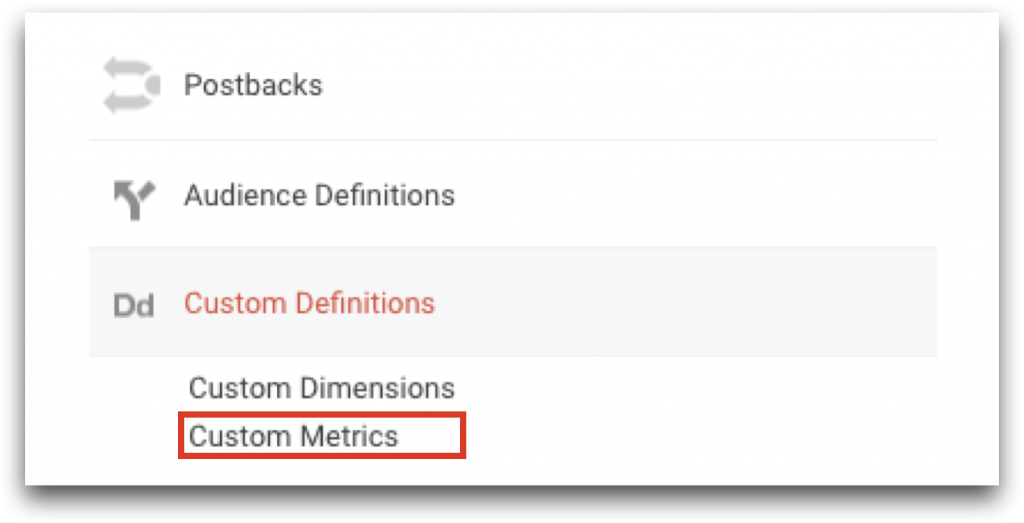
6. Custom metrics
Just like for custom dimensions, navigate to Admin | Property.
But this time click Custom Metrics directly below Custom Dimensions.
Similar to custom dimensions, custom metrics can have different scopes.
Use consistent naming conventions to ensure your team can easily recognize and use the custom metrics.
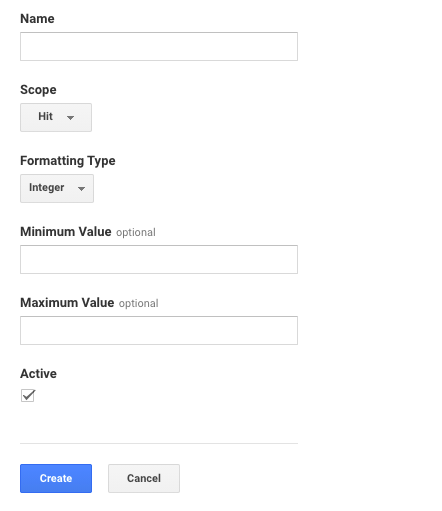
- Custom metrics are hit-scoped
- Formatting type is integer
- Specify a minimum and/or maximum value if you need to
After you have created a custom dimension or metric in your property, you must also modify your tracking code. This should be completed by a qualified developer. Follow the instructions in the Developer Guide for your specific environment:
Website tracking: For Universal Analytics (if using gtag.js)
Mobile app tracking: For Android and iOS mobile apps.
7. Analyze user journeys through your content
To understand how users interact with your content across platforms and devices, and from event type to event type, you can implement User-ID to uniquely identify users, and use the path analysis technique to see which paths they take.
A path analysis starts with a screen or an event that marks the first step of the user’s journey. You can then see the next top-five screens viewed or events triggered by the user.
You can also create a backward path, which shows the steps leading up to a final step. Along the way, you can expand the graph to show what users did in each step.
An example of this is if you start with a screen, you might see that users viewed an image of a product on your app, then tapped to read a description on another screen, and then completed the purchase on your website.
If you want to examine the succession of events, you might start with ad_exposure, then see which ad_click events follow that, and which view_item, add_to_cart, and ecommerce_purchase events follow ad_click.
8. Compare converters and non-converters
To compare converters and non-converters:
- Create the conversion events you want to compare
- Enable those events as conversions in Analytics
- For each conversion event, create one audience that includes the event and another audience that excludes the event
- Compare those audiences in reports via comparisons
With these comparisons applied to your reports, you can compare the behavior and attributes of both audiences side by side.
You can also create comparisons based on conversion events in Analysis.
6 Use cases for advanced users
So you’ve been using Google Analytics daily for a while and want to do more with your data. Here are seven more advanced ways to use Google Analytics for SEO.
1. Take conversions further with multiple goal tracking
Take for instance you have different email lists that users can join, so they have separate thank-you pages tailored for each specific list.
You can combine them into a single email signup goal.
Create a goal on Google Analytics as normal, but when you get to the final step, choose regular expression instead of equals to.
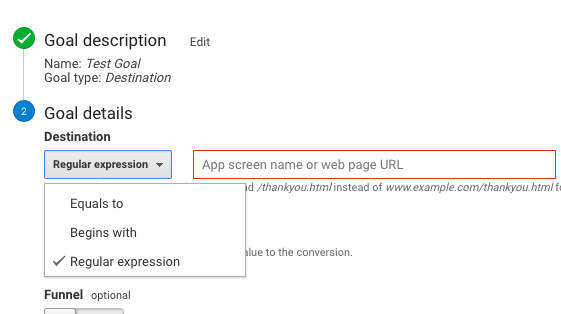
This allows you to use regular expression statements to create a goal that matches multiple pages.
For example, if I had two destination pages after a user signs up:
- /thank-you.html
- /download
You would enter:
/(thank-you.html|download)$
The vertical line (“|”) represents an OR statement.
This says that if the Url matches a value on either side of the line, it counts as a goal.
The brackets identify where it starts and ends.
Finally, the dollar sign marks the end of the regular expression.
If you have multiple Urls that contained “/download”, you would use it to avoid counting the other pages as well.
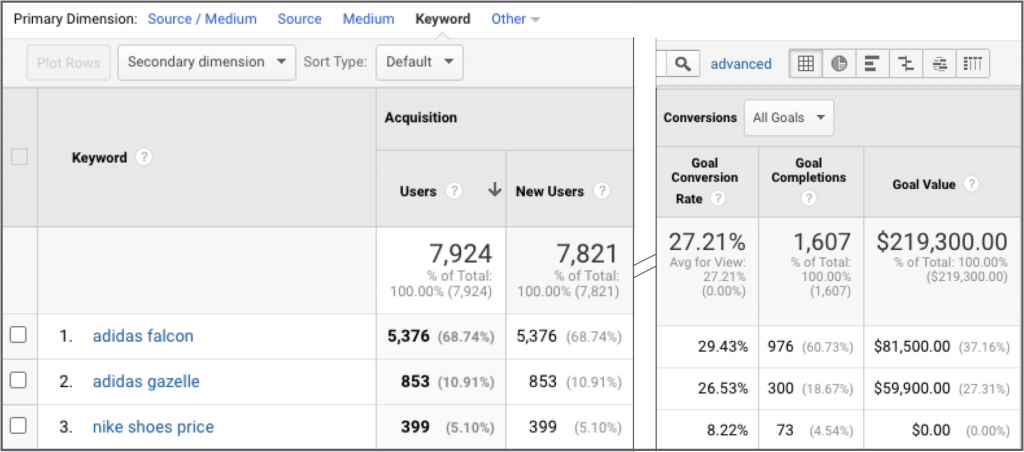
2. Track conversions by keyword
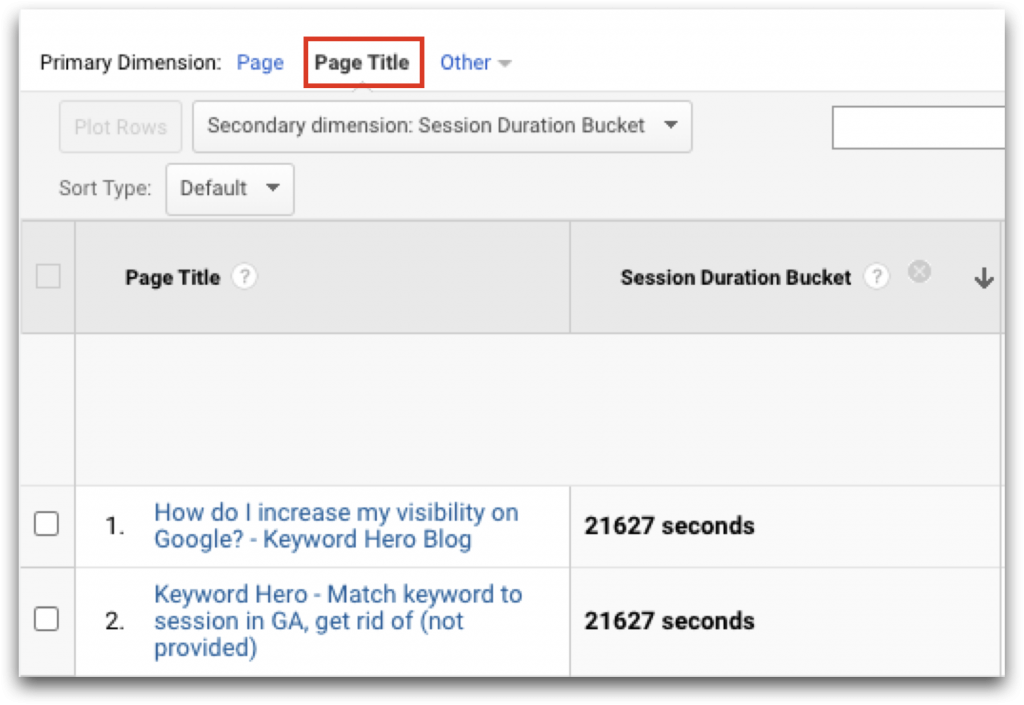
If you access Google Analytics then navigate to the Organic Search Report.
Your view will probably look something like this:
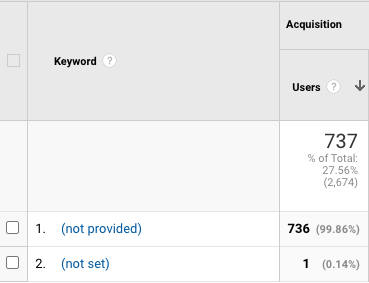
99+% of keywords marked as (not provided) or (not set).
You can get this view down to less than 2% of all keywords by using Keyword Hero.
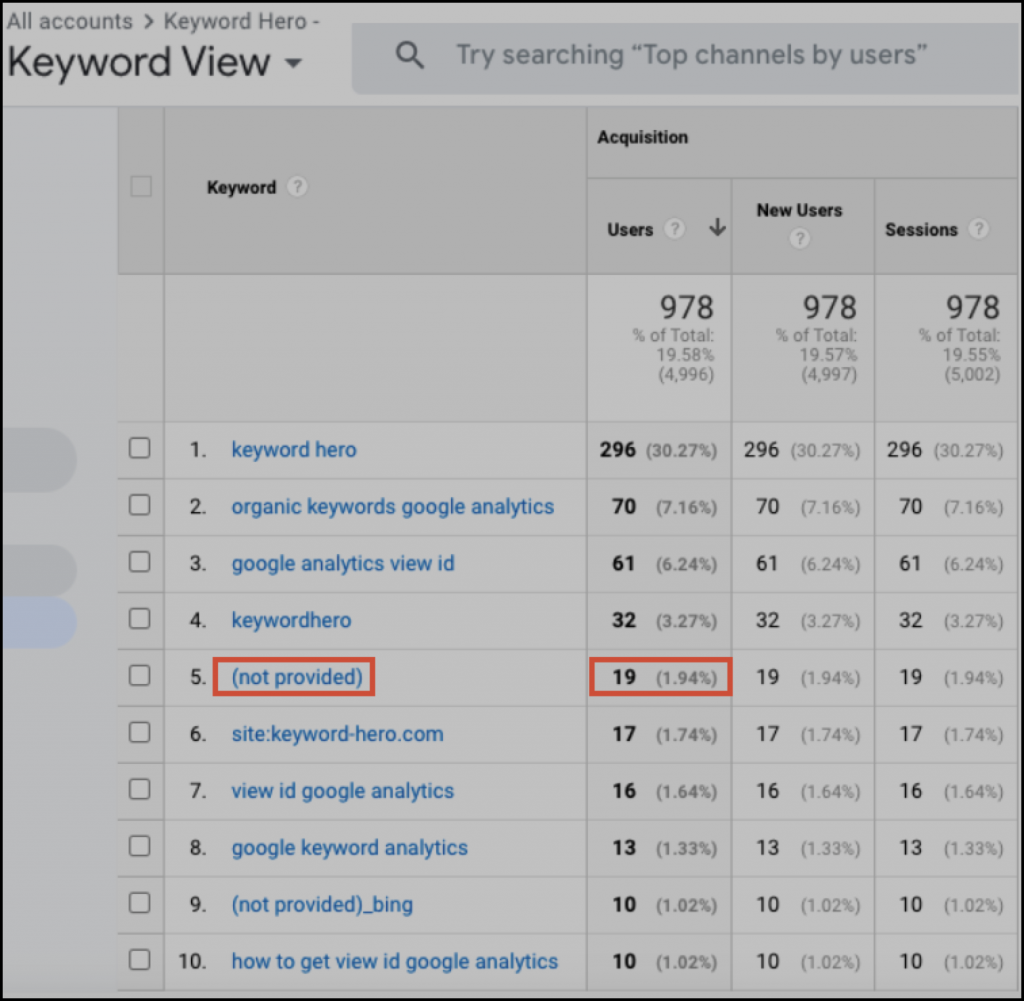
Once you do you can track organic keyword conversions.
Before you begin.
You will need:
- A website: This is where you’ll put the conversion tracking code, called a “tag”
- Ability to edit the website: Either you or your web developer will need to be able to add the tag to your website
Google has a step-by-step guide conversion tracking guide for Google Analytics.
Once you have Keyword Hero and conversion tracking setup you can see which keywords are making you the most money.
3. Power of segmenting
As anyone who has worked on growing a website or page optimization will tell you, overall numbers are not insightful.
To see if your work is having an impact, you need to take a more granular look at the data.
In the context of Google Analytics for SEO, a segment allows you to look at your traffic and user stats for a smaller group of users. For example, you could segment by:
- Traffic source
- Device
- Browser
- Page
- Landing page
- Returning vs new visitors
How do I create a new segment?
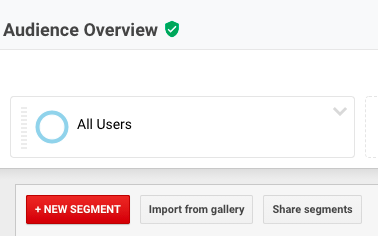
Go to Audience | Overview.
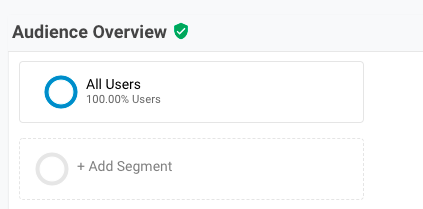
Once you click Add Segment a screen with template options will appear with everything from New Users to Converters.
However, you might want to create your own segment.
It is interesting to see your data update visually as you select different segments.
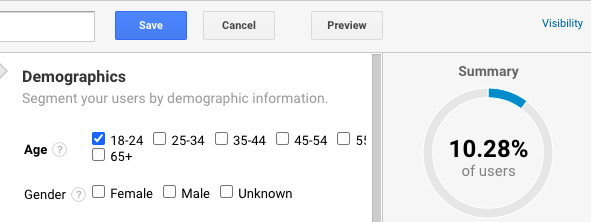
Once you save it, you will get an updated graph with your new segment.
4. Product impact
To dive deeper into changes you can access the Ecommerce Overview report to determine what you can do to boost sales.
Go to Conversions | Ecommerce | Product Performance.
See changes in revenue by product and product category or select “Product Revenue” in the explorer at the top left of the report to see how much revenue each product is generating.

You can select product SKU, product category, and product brand as dimensions to further analyze trends by product offering and optimize your site based on what users are engaging with.
For example, if you are a fashion retailer seeing a drop in overall revenue, but after diving deeper into product performance you see an increase in the Nike runners product category, you can take steps to optimize that product category by presenting it more vividly on the homepage of your site, running a promotion, or highlighting it in a marketing campaign.
5. Goal impact
As an experienced Google Analytics for SEO user, you will already have goals set up in your Analytics property.
By going to Conversions | Goals | Overview.
You can track changes in goal performance.
By comparing the change in total goal completions for a period of time you can see if you need to optimize the different goal completion locations.
From there you can dive deeper to see changes in specific goals.
For example, if store locator usage is down but product page views and purchases are up. This could be a sign that your customers are purchasing more online than in-store.
6. Funnel visualization
Going one step further from the last use case you can analyze how users move through the purchase funnel, by going to:
Conversions | Goals | Funnel Visualization.
There you can see if there’s been any change in goal completion and / or site conversions.
Perhaps the number of users visiting your site is up, but fewer users are making it through the funnel to purchase.
You can determine where users are dropping off and if the percentage of users dropping off at that step is higher than before.
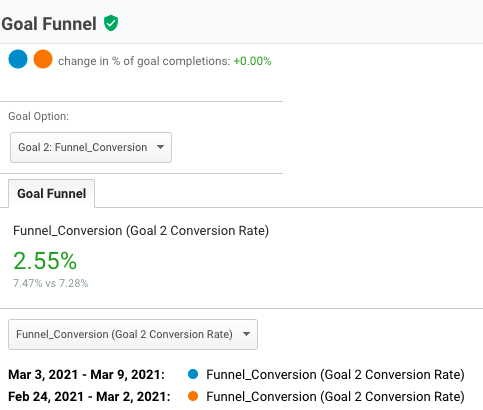
Benefits of enabling goal funnel visualization:
- Gain insights into the user experience or other elemental issues that a particular page in the conversion stage may be facing (bad copy, bad design, confusing component placement, and more
- Identify category issues, overall sight usability issues, and the general visitor experience throughout the website
- Improve conversions