Dimensions and metrics help you to get the most out of your data. Used correctly, you can understand and track user behaviour and make smart decisions based on how your users interact with your site.
In this article we will look at custom dimensions, metrics & dashboards offered by Keyword Hero. These are non-native Google Analytics dimensions and metrics that offer Keyword Hero users even more insight into their keyword data.
If you are new to Google Analytics, we recommend first checking out this article on secondary dimensions for an introduction into standard dimensions and metrics.
Custom Dimension: Date
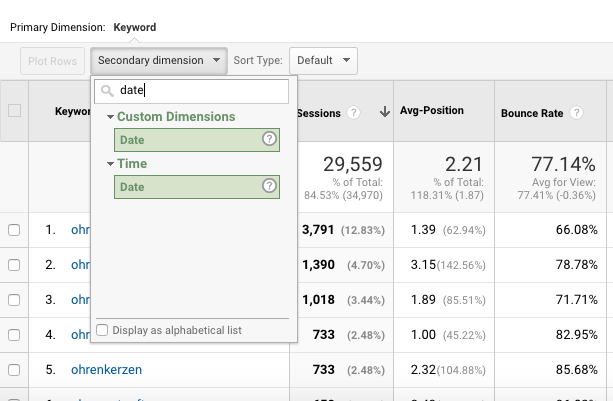
The first custom dimension we are going to take a look at is Date. There is a 3-day latency with Keyword Hero data. Although there is a date secondary dimension in Google Analytics, the Keyword Hero custom dimension allows for the correct date to be displayed in your data. It also presents this date in a more readable format. Go ahead and click on secondary dimension and type in date. Click on Date under Custom Dimension.
You can now see results filtered by date corrected for latency.
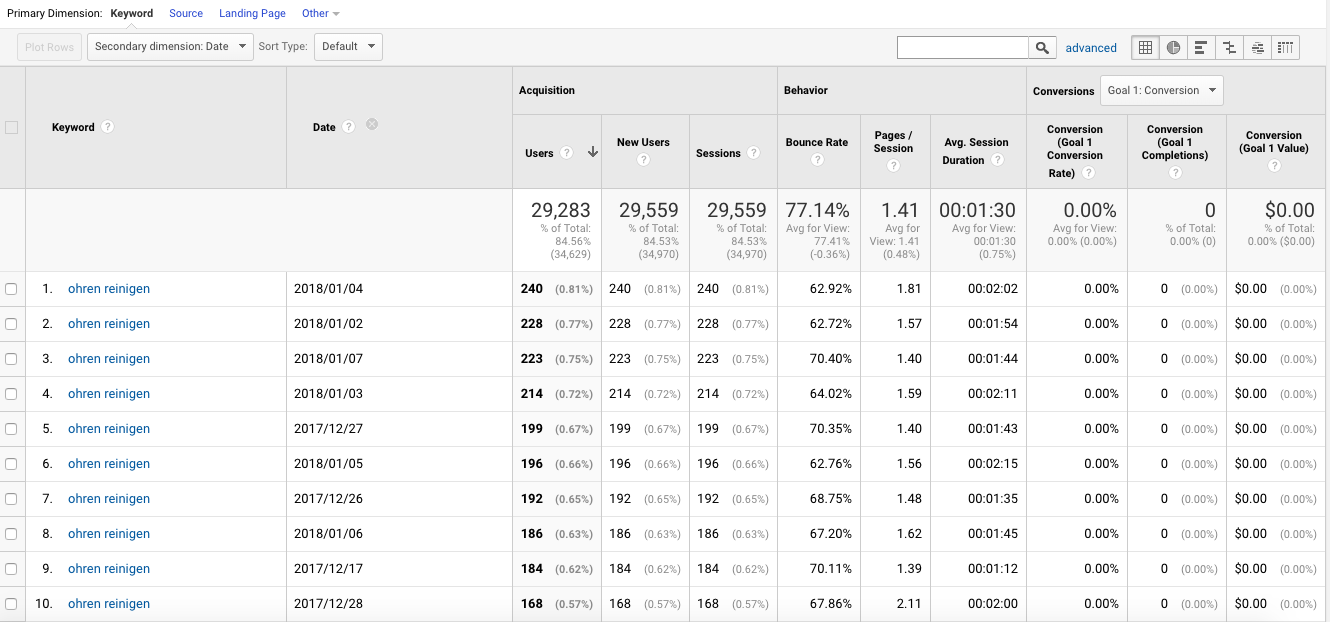
Now that you can link dates to keyword volumes, you can identify traffic spikes and analyze trends. For example, if you notice that users are searching for a particular product in high volumes at the weekend, you can create a targeted campaign around this insight to drive more traffic.
Custom Dimension: Position
The next custom dimension is Position. By filtering by position you can see how your keywords rank in Google search results
 Break down of different ranking instances by keyword
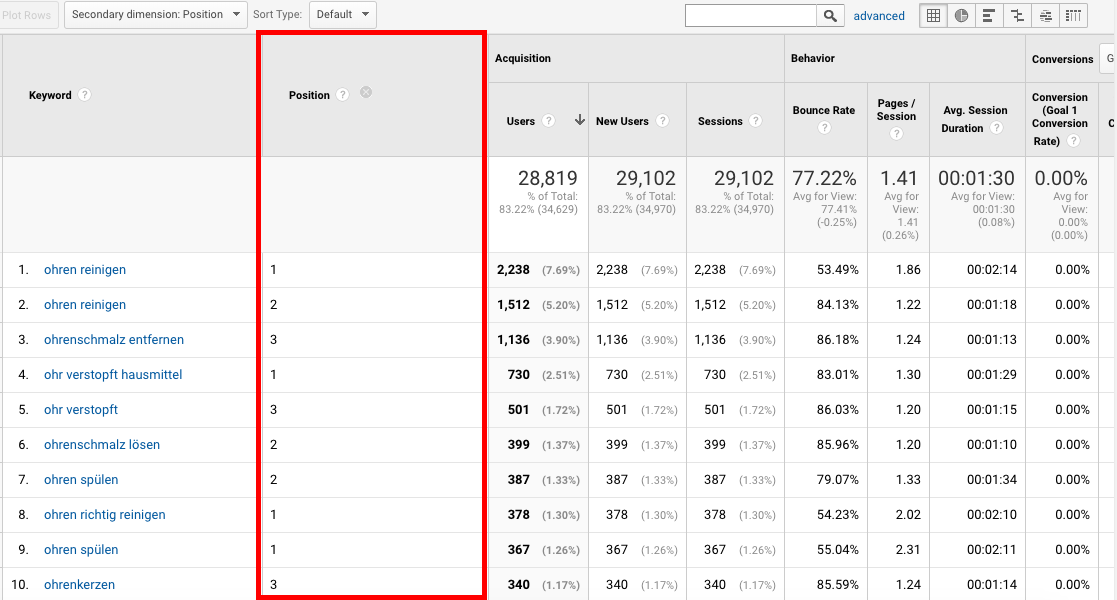
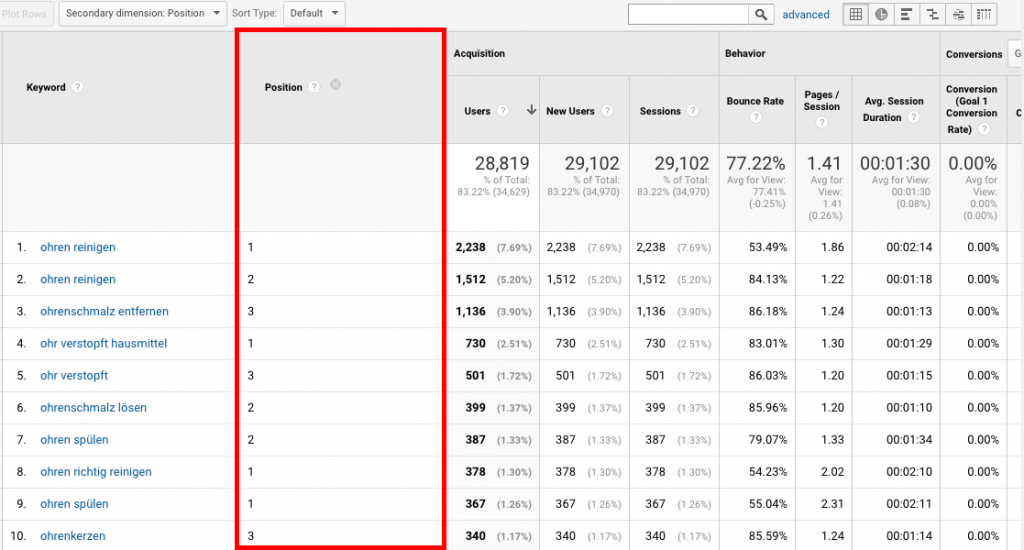
If you click on a specific keyword from the results and choose Position as you secondary dimension, then you can see the breakdown of all the different instances of where your keyword ranked in search results.
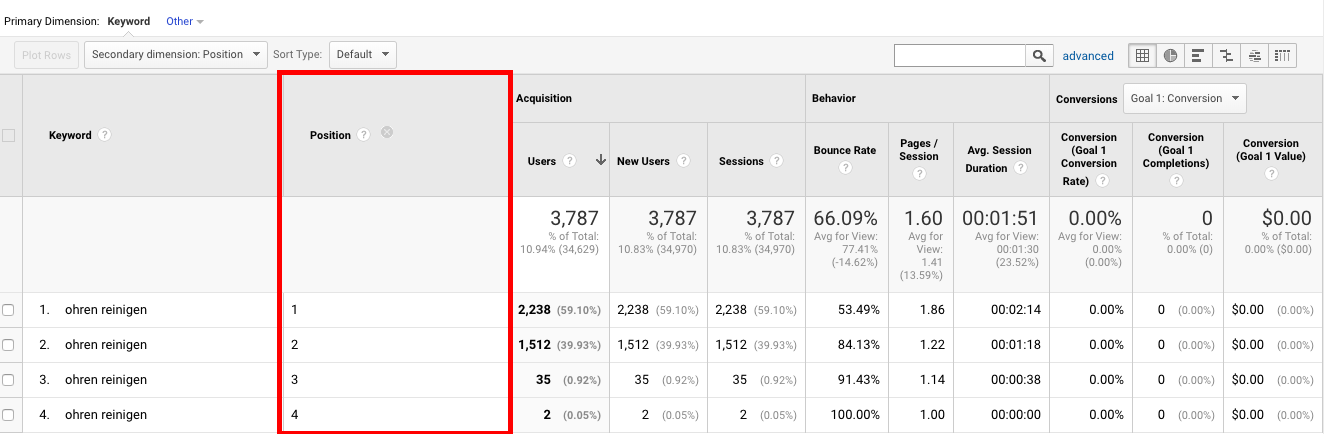
Not only can we compare volumes by rank, we can also see if user behaviour is different by position. In our example here we can see that there is a much higher bounce rate for any other position than first.
If you want to compare performance by position, this is also available as custom dashboard Keyword Performance. Check it out here
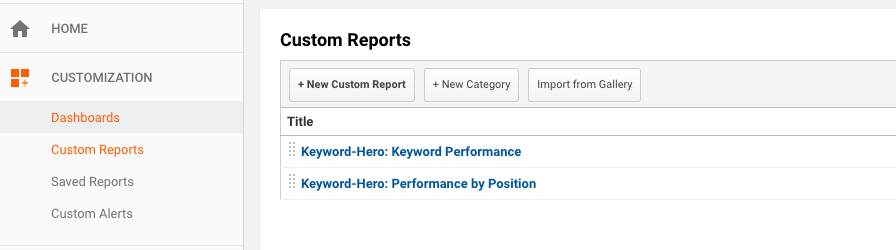
Simply click on a particular dashboard to import it into Google Analytics.
Note: When you import a custom dashboard, remember to import it to your Keyword Hero Google Analytics property. Once you have done this, you can access all your custom dashboards from the Customization tab, then click on Custom Reports. In our case we want to click on Performance by Position.
Our results look like this:
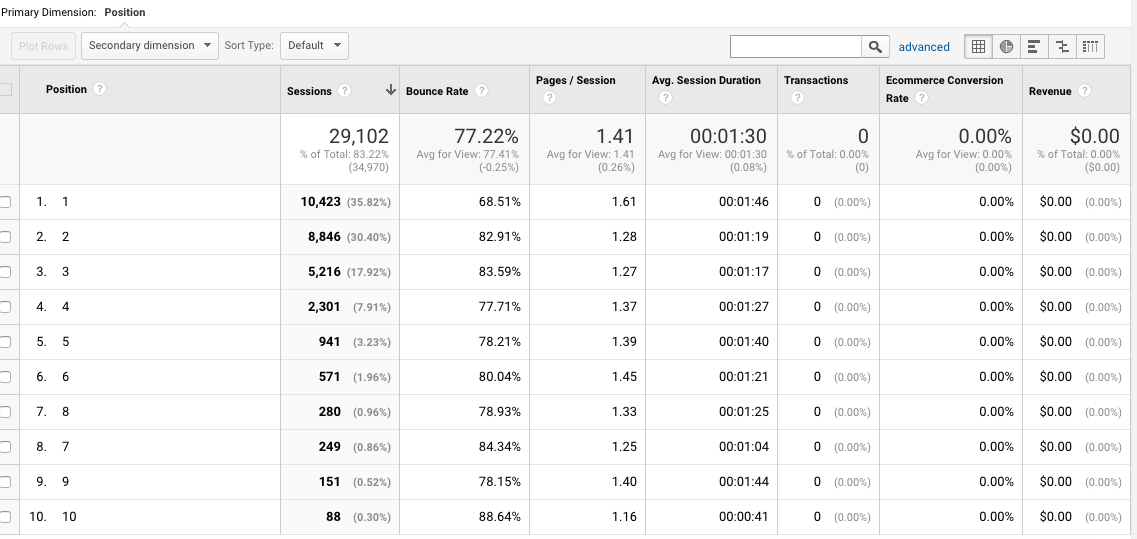
As you can see, all instances of an organic keyword ranking in the Google search results are shown.
Now we can drill down into user behaviour. In our example, we can see that although there is significant user traffic entering the site from positions 2 and 3, the bounce rate is higher and time on site is much lower, meaning these users are less likely to convert. If we add Keyword as a secondary dimension, we can easily identify high volume keywords to focus marketing and SEO efforts on, with the aim of pushing their rankings up to the first position.
Quick win keywords
Using the custom dimension position also allows us to Identify keywords that are almost on the first page of the search results and need a little boost – that is positions 11, 12 and 13. Getting these keywords to rank on the first page could potentially lead to huge traffic gains.
This is also available as a custom dashboard here – import this custom dashboard to try it yourself.
Here are the results:
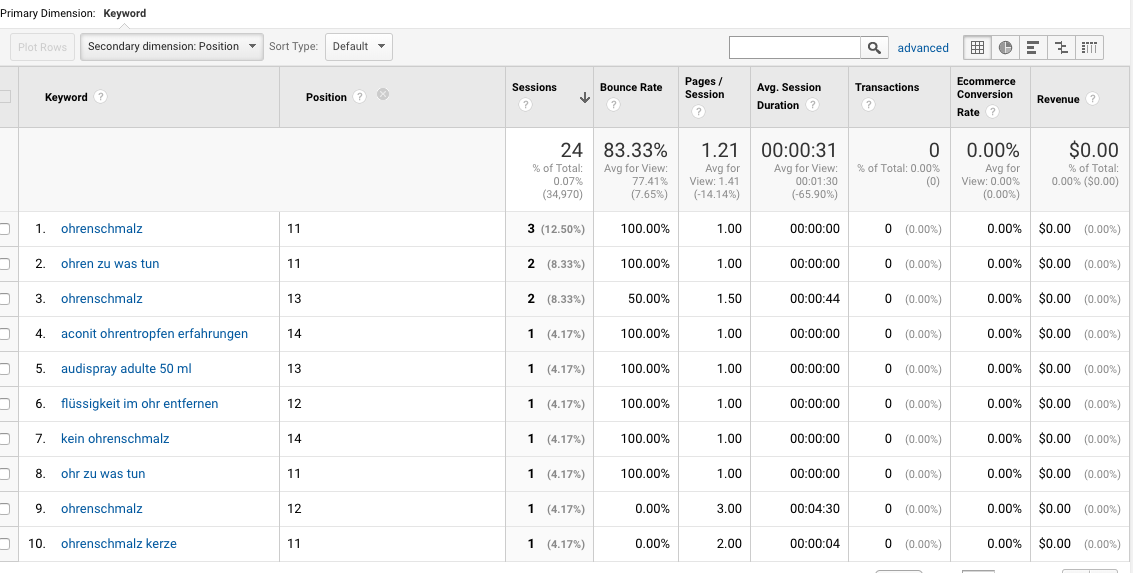
Please note that Position has been added as a secondary dimension to illustrate the positions this custom view has found. By default position is not shown. These results are ranking on page 2 of the SERPs. Focussing marketing and advertising efforts on these keywords could boost them to the first page and drive traffic.
Custom Dimension: Brand
The next custom dimension is Brand. Keyword Hero is able to automatically sort your brand from your non-brand keywords. Brand performance is also available as a custom dashboard – import this dashboard to follow along with this example.
Note: It is important to understand that brand keywords are keywords related to your specific brand. For example, if you have an online store that sells Adidas trainers and clothes, Adidas is not a brand keyword as this is not your brand. This is a product sold under your brand.
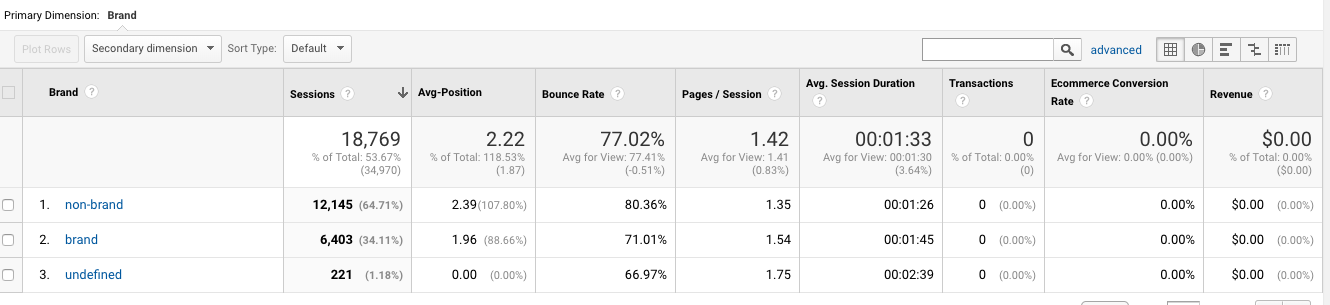
Clicking on brand allows you to see the performance of individual brand keywords.
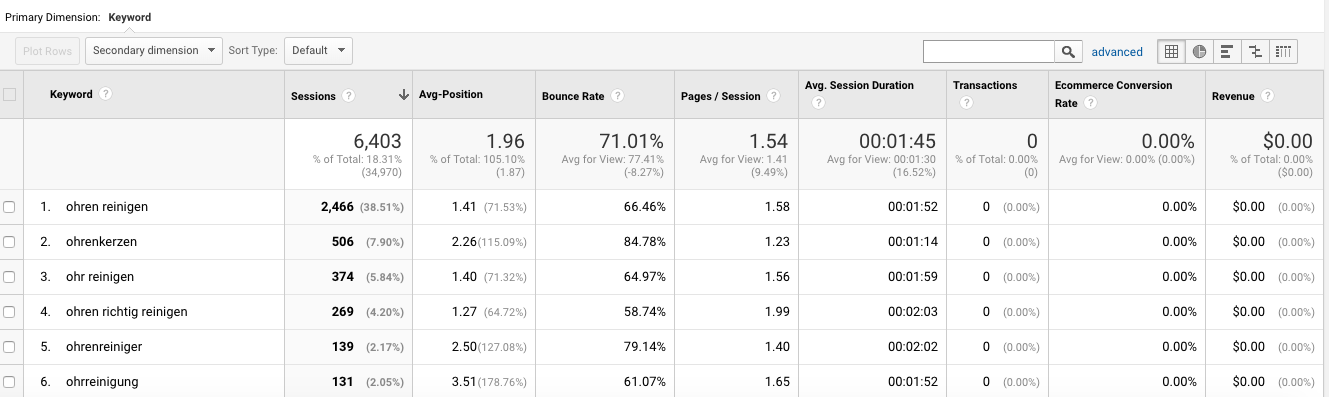
This allows us to make sure important brand keywords are performing as they should. If we notice that a brand keyword we should be owning is underperforming, we can use SEO and ad campaign to try and boost its ranking.
Custom Metric: Average Position
Now let’s talk about a custom metric. Keyword Hero allows you to see the average position as a custom metric. You can use this to see how keywords perform over time, but also compare other secondary dimensions.
The easiest way is to get started with this custom metric is to import the Keyword Performance custom dashboard.
Note: you will also need to set up average position as a calculated metric. You can read how to do this on our custom dashboard page.
Once you have set this up and imported the dashboard, click on Customization > Custom Reports and select your dashboard.
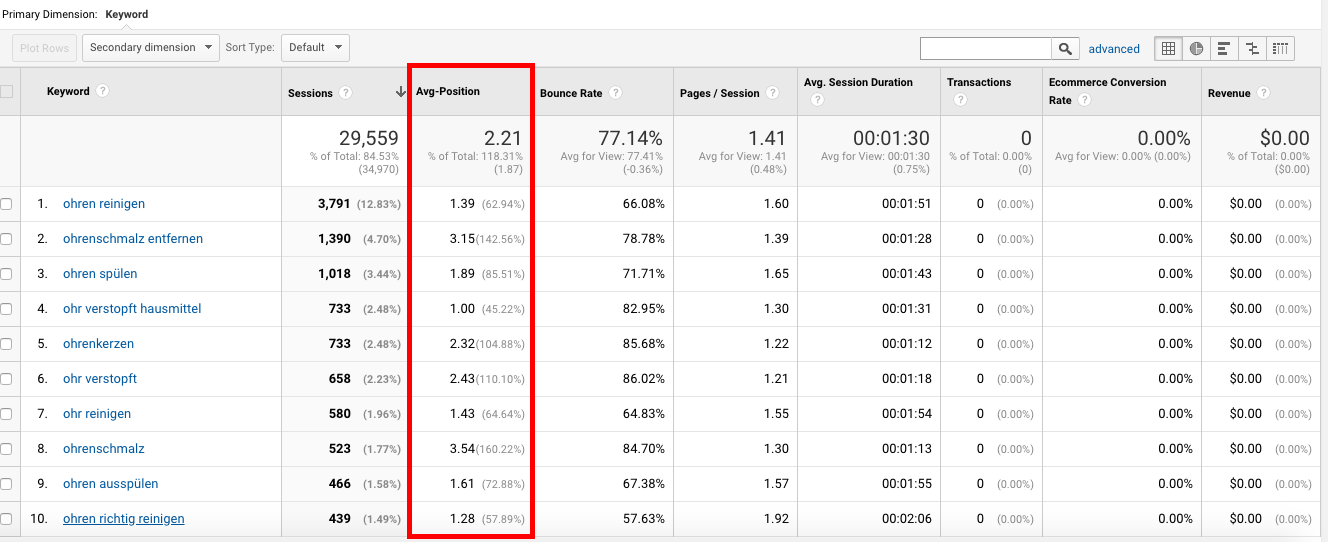
In our results you can see that we can now see the average position. This is calculated by looking at all the individual instances of where an organic keyword ranks and averaging this. This is useful to track keyword performance over time.
Keyword performance by device
If we import the custom dashboard Device Performance we can see the average position metric filtered by device. In our example below we can see that traffic wise, and position wise mobile is performing a lot better than desktop and tablet. (Please note, the metric average position also needs to be set up for this dashboard.)

Again as with all custom dashboards we could add secondary dimensions. For example if we add Keyword, we can see that keywords, filtered by device with their average position.
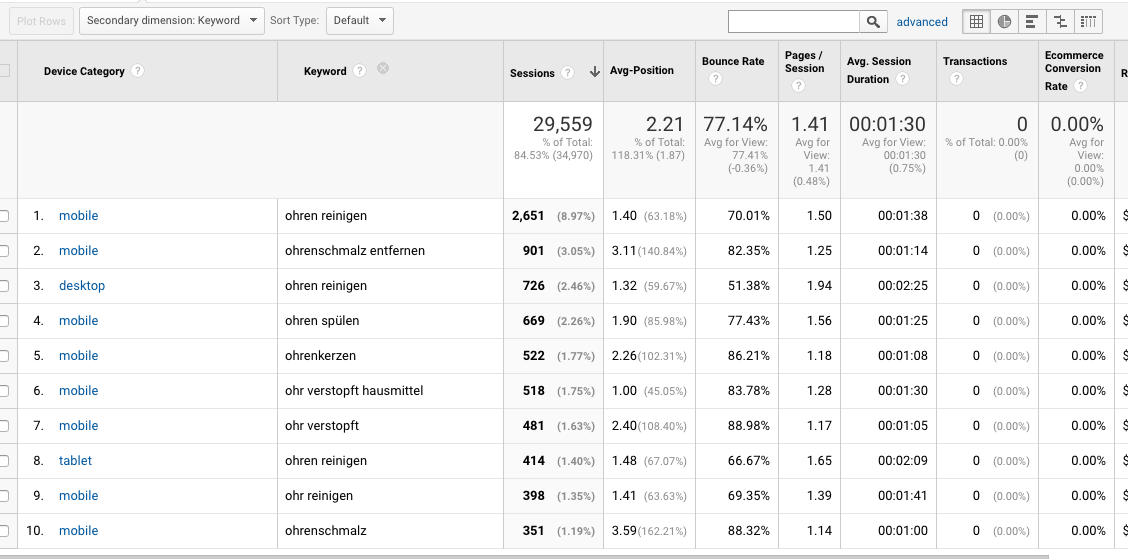
In our case, we could perhaps look to see how we could boost the ranking of high volume desktop and tablet keywords.
Custom Metric: Impressions
Another custom metric is Impressions. Here Keyword Hero enables you to see the number of Google SERP impressions for your respective keywords. So you are able to derive click through rates from Google SERPs to your landing pages as a base for further optimization of your content
Please note:
The custom metric Impressions is filled with data only if “Last Click Attribution” is chosen as attribution model, because otherwise data for Google SERP impressions and corresponding sessions may seem inconsistent.
To find out more about attribution model settings, you may read our corresponding article.
Final thoughts: experiment with metrics, dimensions and dashboards
This article introduced you to some of the key custom metrics and dimensions in Keyword Hero. Used correctly, they can provide you with extremely powerful insights into your keyword data.
Remember: Even with custom dashboards you can still add secondary dimensions to gain even more granular insights. Be sure to check out our custom dashboards page to see our other dashboards.
By combining these dimensions and metrics, you can create your own use cases individually tailored to your needs. We recommend experimenting with these custom features to get the most out of Keyword Hero.