Secondary dimensions are a powerful tool for gaining deeper insights into your website’s visitors. Learning how to use these can help you get the most out of Keyword Hero. This article will show you how to understand and get started with secondary dimensions.
What is a Secondary Dimension?
Firstly let’s define the difference between dimensions and metrics.
Metric: A metric is a measurable piece of data. This is how your users interact with your site.
Dimension: a dimension gives context to a metric. A dimension is a way of filtering users that interact with your website. A dimension usually tells you which specific users interact with your site.
Examples of Metrics
Before we take a look at some examples please, make sure you are in the correct view in Google Analytics.
First make sure you are in your GA Keyword View account – not the default account associated with your site. This is a mirror of your GA data used by Keyword Hero to provide you with keyword data.
Once in this view, click on: Acquisition > Overview > Organic Traffic
This is the view we are going to use throughout this article.
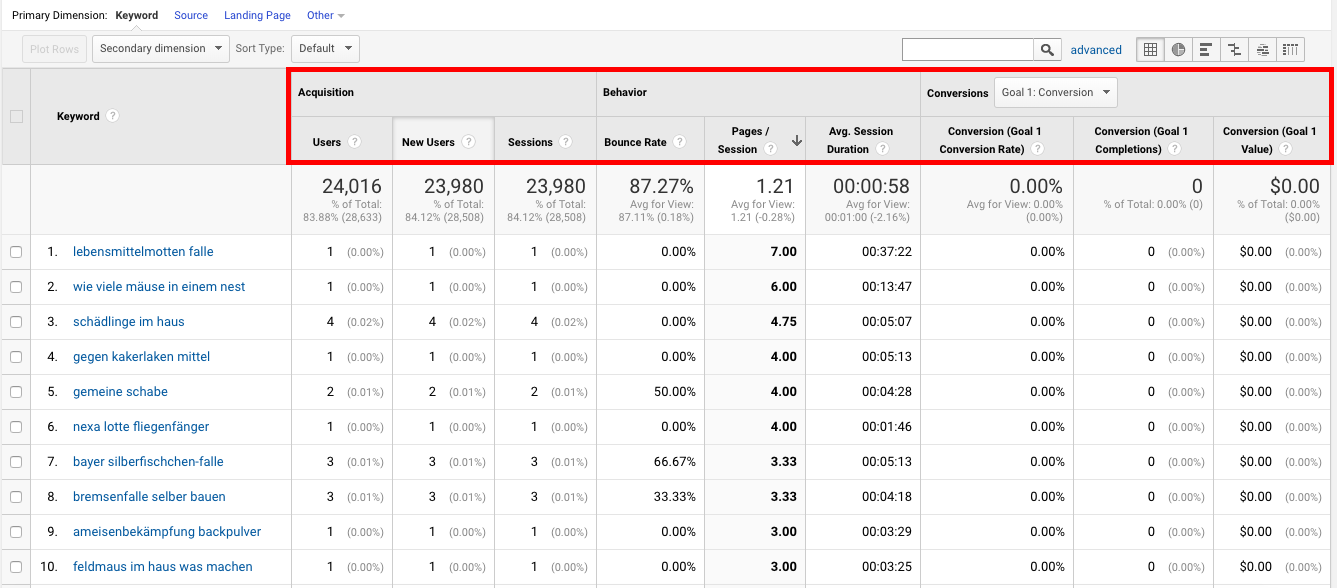
Take a look at the screenshot above. Any header above a number is a metric. As you can see by default metrics are split into three categories: Acquisition, Behaviour, and Conversion. Common metrics include the number of sessions (number of sessions on your website) and Bounce Rate – how long a user spends on a page before leaving.
Examples of Dimensions
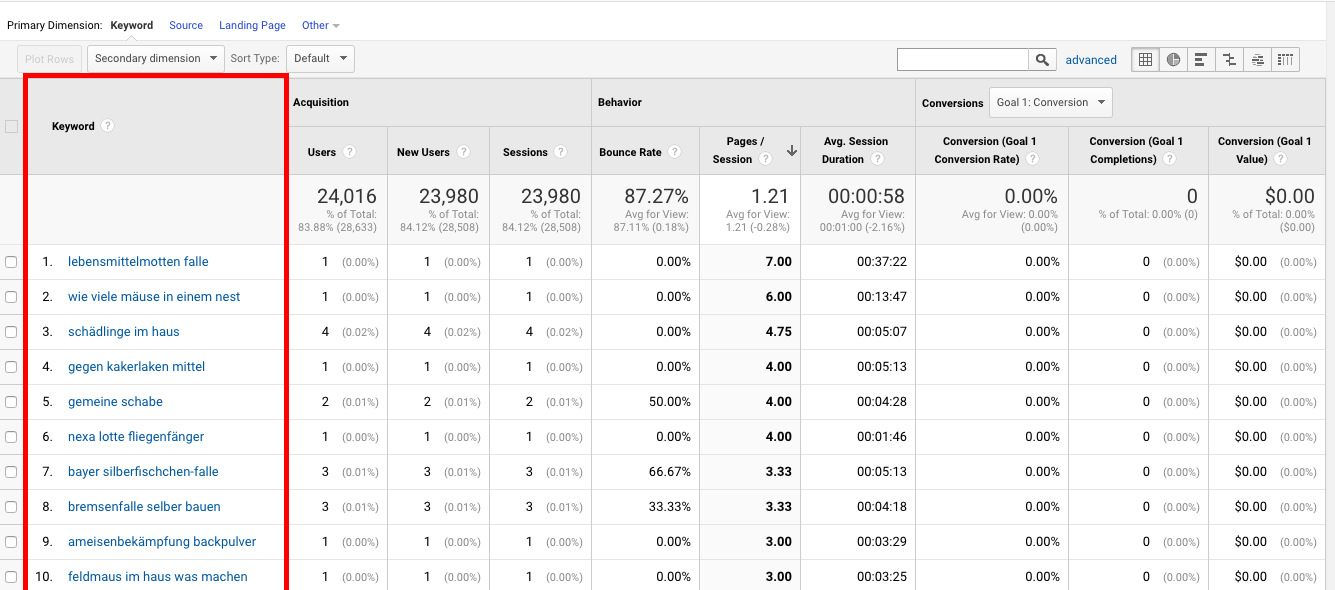
By default Keyword Hero sets your primary dimension to Keyword.
This means that we can see how people interact with your site based on the organic keyword they typed into Google. We can sort this data by clicking on a metric.
As an example lets’ click on Users. This will sort your data based on the number of users who interacted with your site. Users is the metric, Keyword the dimension.
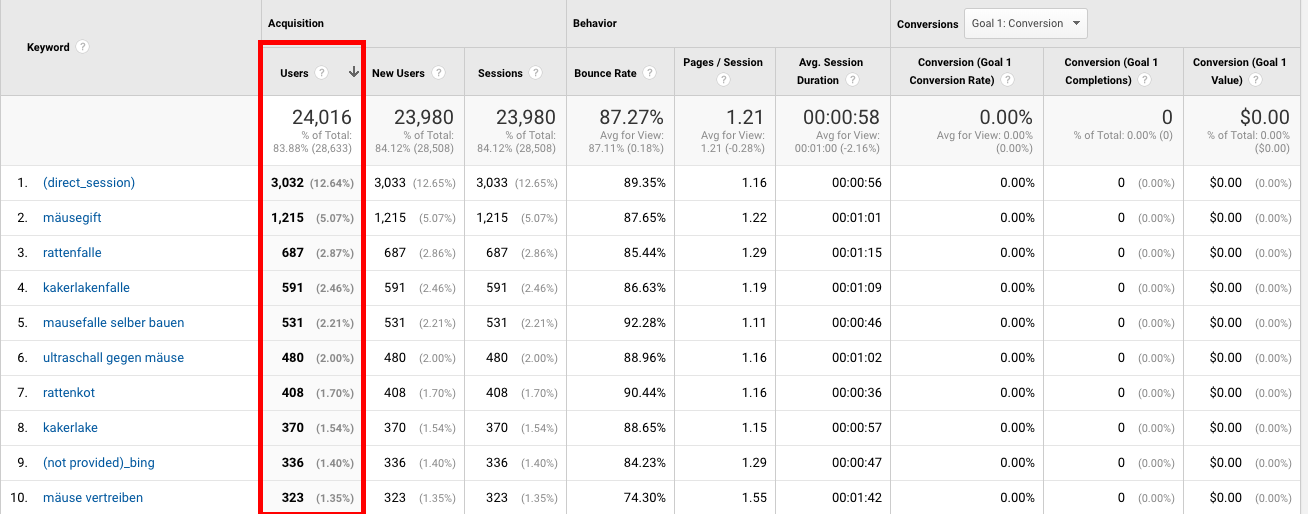
As you can see now there is a little arrow pointing down next to Users. This means we have sorted our data in descending order by the metric Users. This enables us to see the top performing organic keywords by number of sessions. You can sort your data by any metric.
Adding a Secondary Dimension
Now this is where things get interesting. We are going to add a secondary dimension.
We are going to focus on two very useful secondary dimensions:
- Landing Page
- Device Category
Keyword is our primary dimension. This means that all of the metrics we are going to see are in relation to your keyword data.
Secondary Dimension: Landing Page
By selecting Landing Page as our secondary dimension we can see which page people land on at the keyword level. Let’s give this a try.
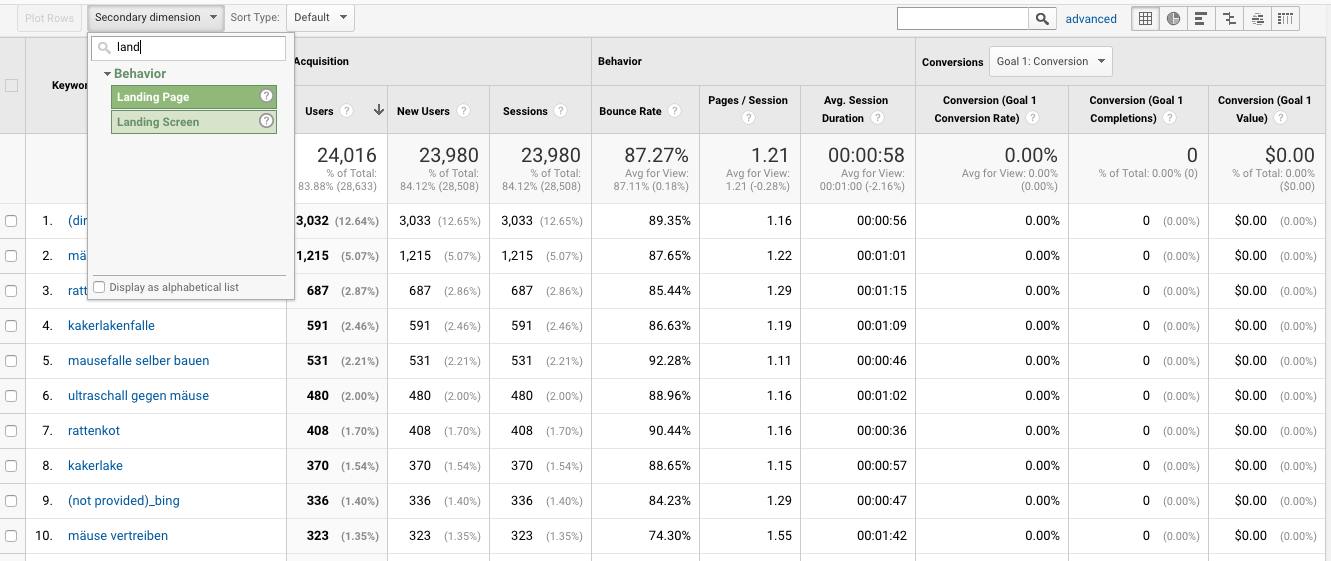
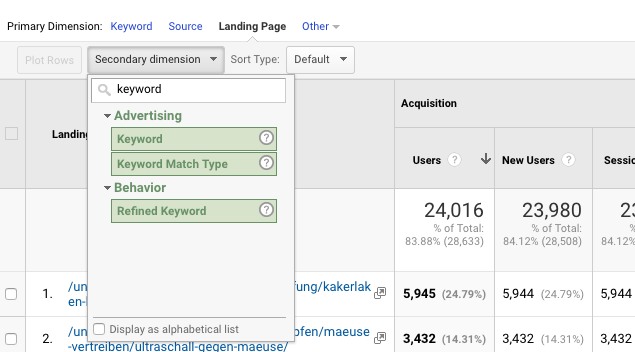
To do this, click on secondary dimension. Now type Landing Page and select this option.
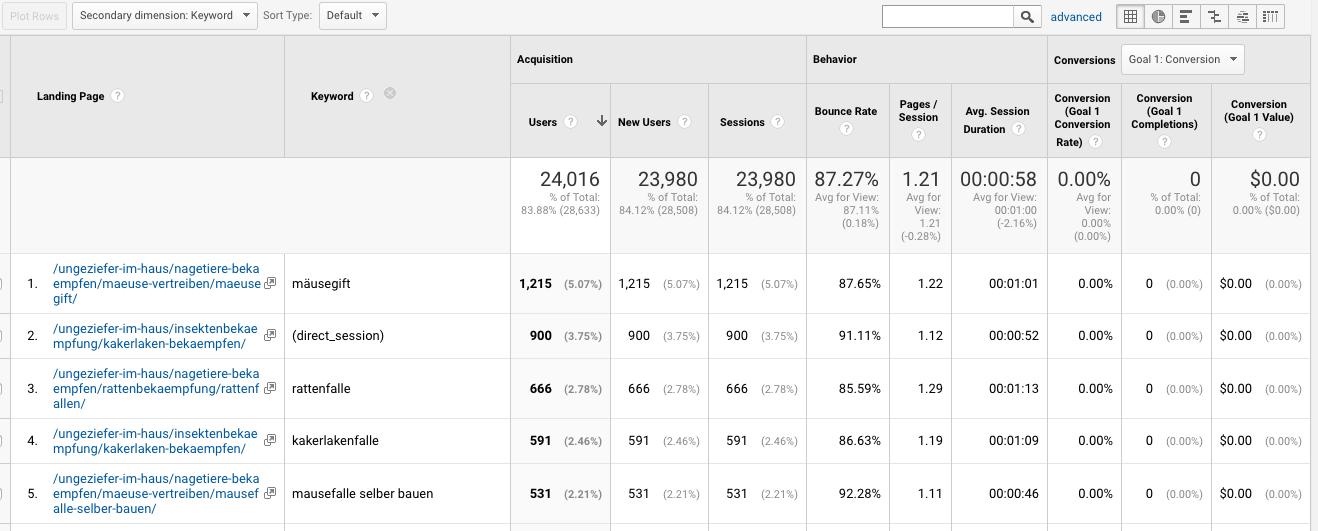
Now you can see which landing pages have the most traffic based by which organic keyword a user arrived at your site. This is interesting because we can learn how specific keywords perform on different landing pages.
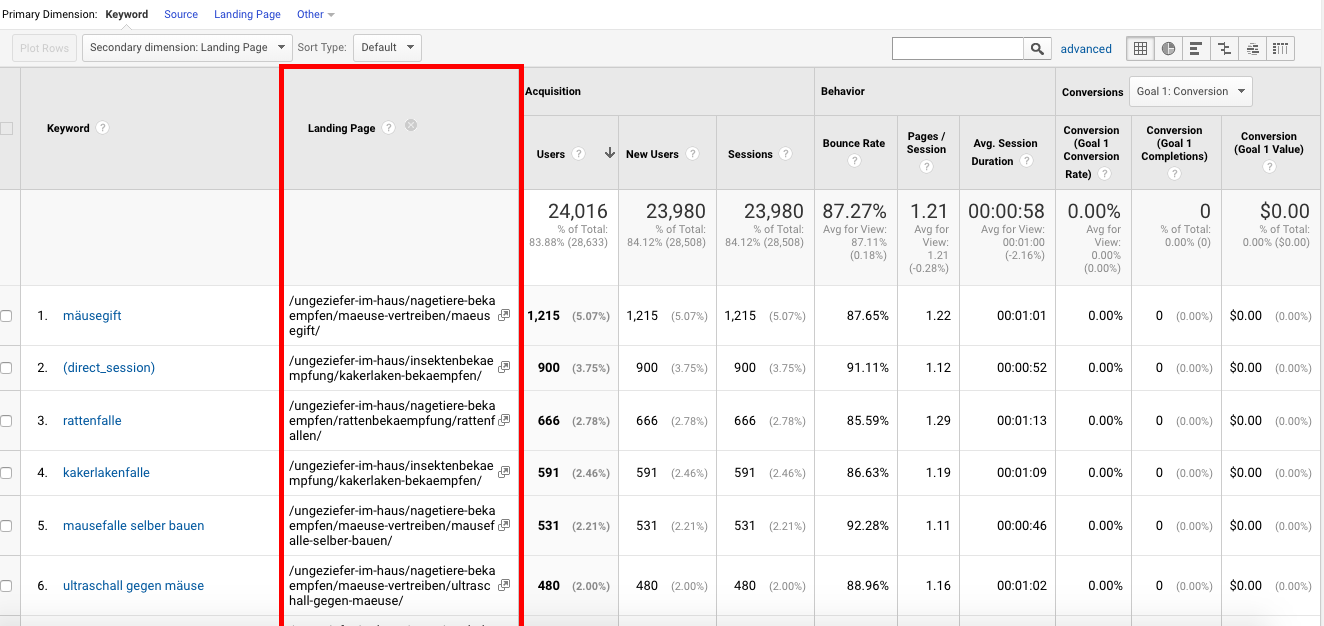
This is useful to make sure the web pages that our high traffic keywords land on are performing as we expect.
If we spot a high traffic keyword where the bounce rate is high, for example, we may need to check that this landing page is optimized for this keyword.
If the keyword is a query, we may need to make sure your landing page is answering this question and providing relevant information relating to this keyword.
Additionally, we could check on-page factors and ensure that the user experience is good. This technique helps you convert your high volume keywords and stop them bouncing.
See All the Landing Pages Users Interact with by Keyword
Let’s take this one step further. Maybe we want to see all of the landing pages that a specific keyword lands on, and how these users interact differently. So click on a keyword from the results. As before, click on secondary dimension and filter by landing page.
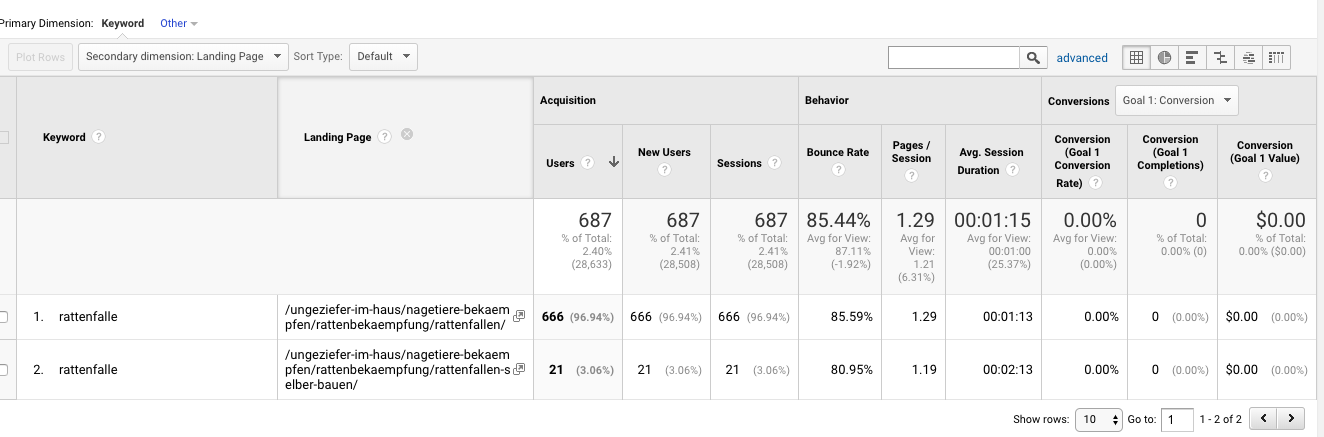
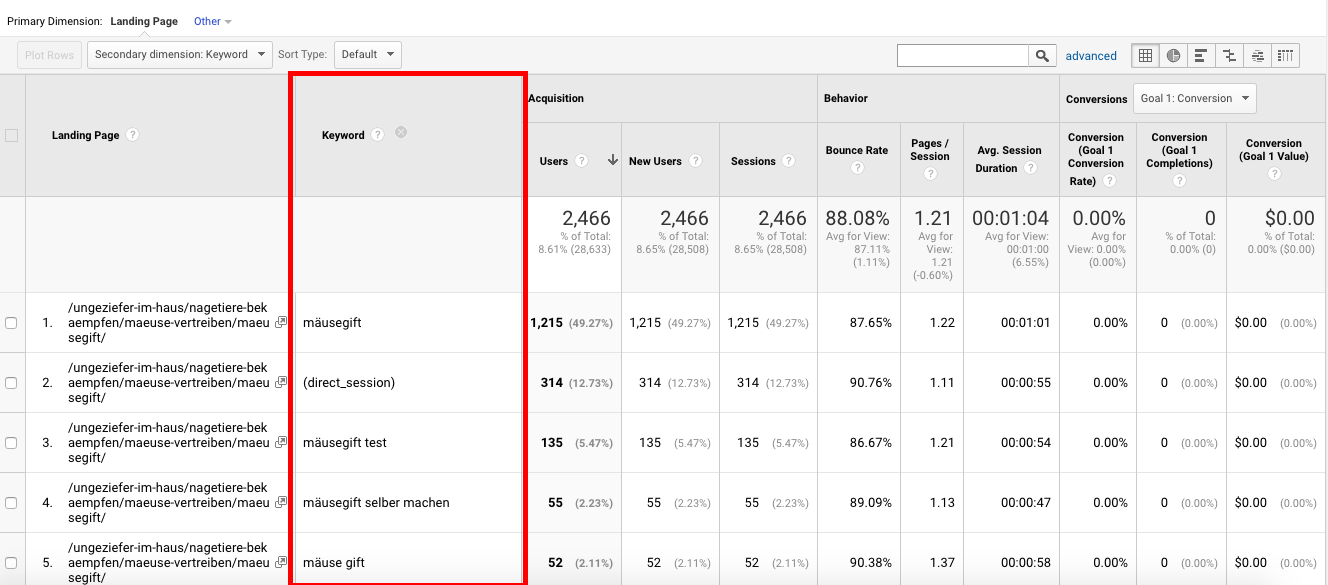
Now we can see all the landing pages that a specific keyword lands on. In the example above, we can see that our keyword lands on two different pages. Now you can use the metrics to see if there are any differences in user behavior.
Firstly, we can see that the one landing page is gaining over 95% of the traffic. In this case, it may be worth merging the second landing page into the first as most traffic may flows to this page anyway.
You can also compare the bounce rate. For example, if you see that one landing page has a much lower bounce rate you should consider combining these landing pages.
Secondary Dimension: Device Category
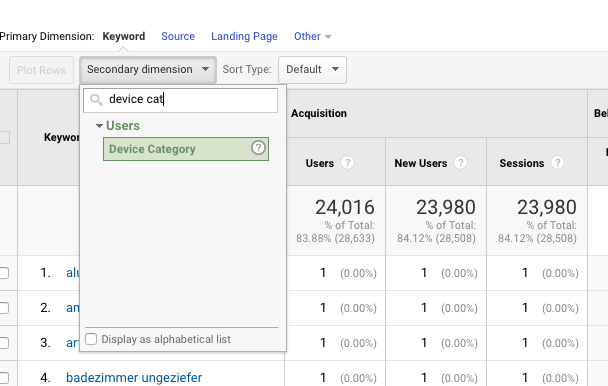
By selecting Device Category (Desktop, Mobile, and Tablet) we can see how the traffic split is between different device types. The steps for doing this are exactly as above. This time we are going to click on secondary dimension and type in device category. Click on device category to filter your data.
Now you can see which device each user had per keyword.
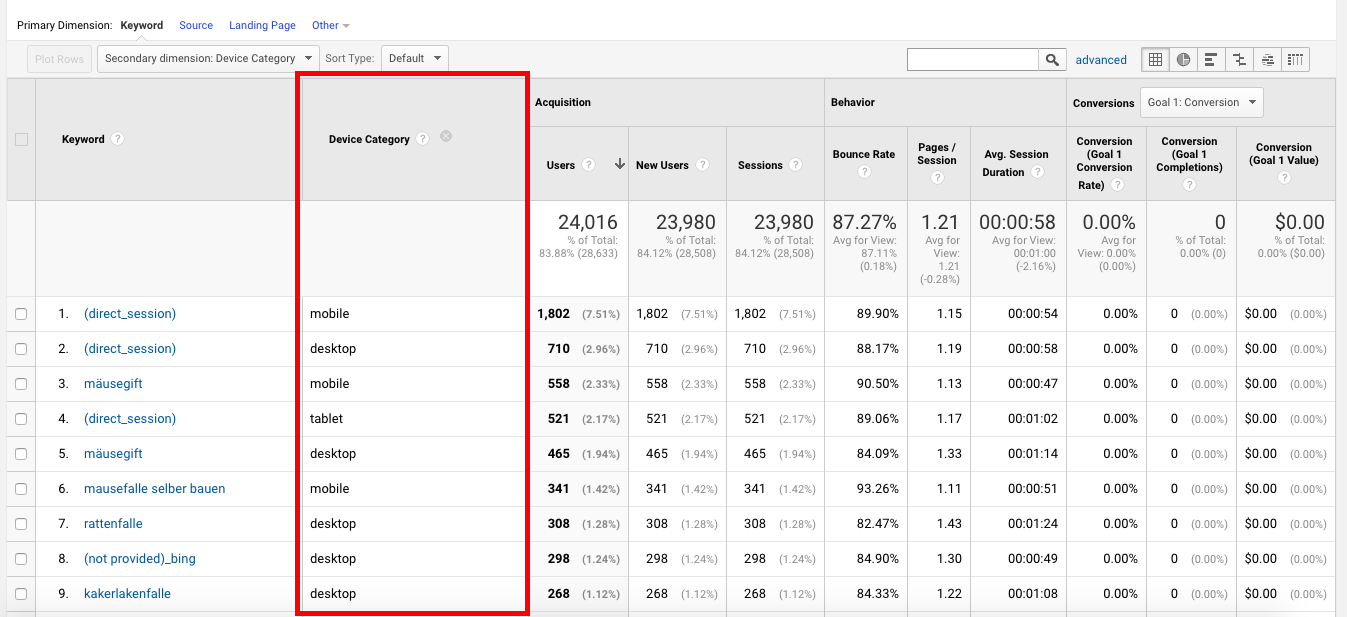
Again this is also possible on the keyword level. If you click on a keyword you are interested in, and filter by device category you can see which individual keyword data segmented by device.
Take a look at these results:
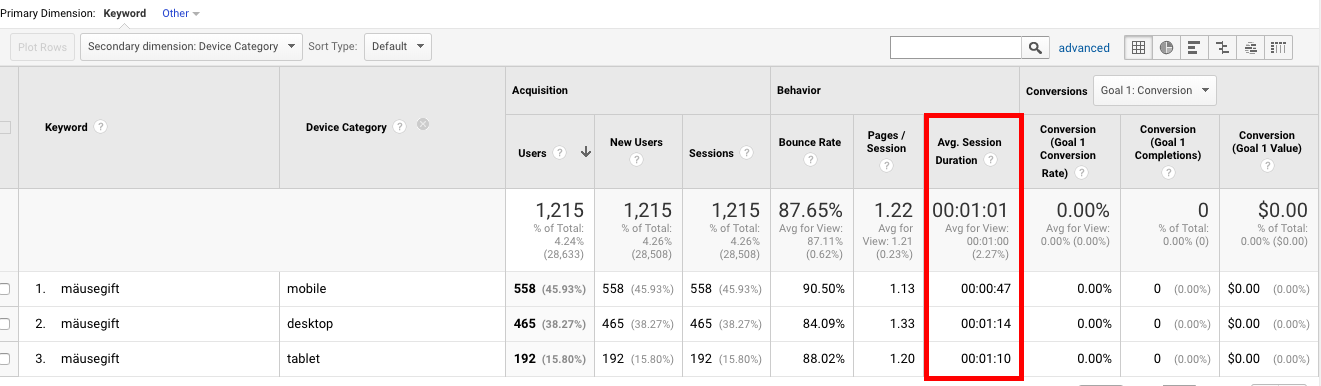
Here we can see that for our chosen keyword, mobile traffic is outperforming desktop and tablet. Despite this fact, mobile users are spending less time on the page on average and have a higher bounce rate. In this case, we may need to check that the page is mobile optimized to improve our bounce rate and time on page.
Other Useful Secondary Dimensions
While there are quite a few different secondary dimensions native to Google Analytics, some are more useful the others in the context of keyword data. However, we recommend experimenting with these and getting used to sorting your data.
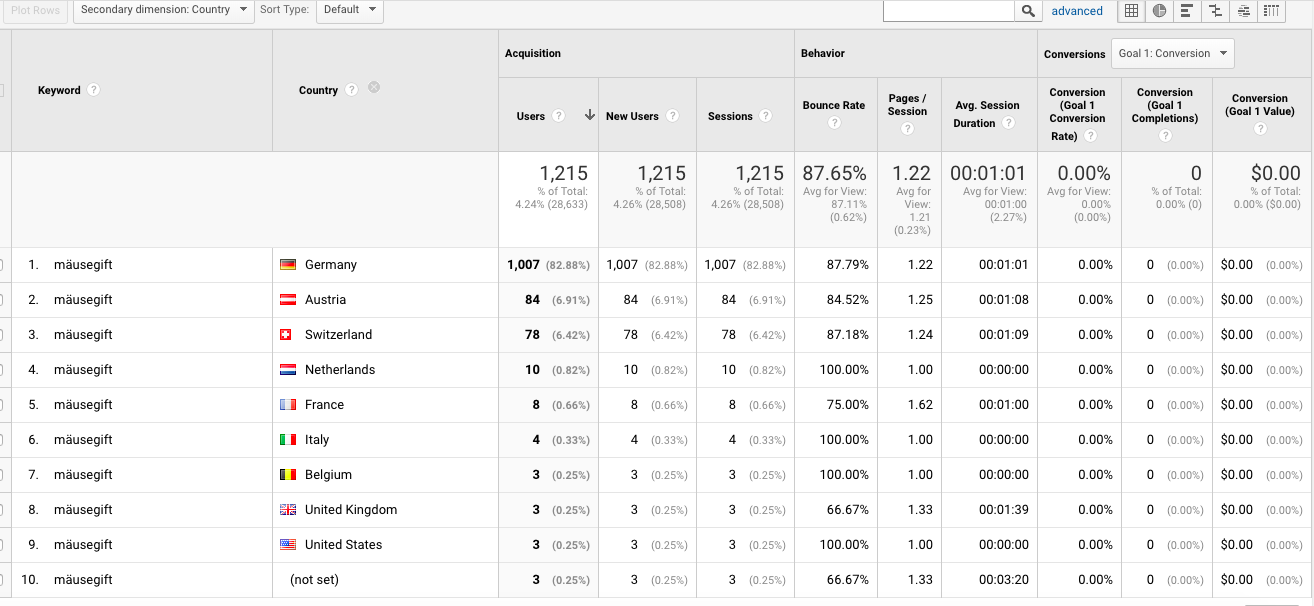
Another interesting secondary dimension is sorting users by country at a keyword level. To do this simply click on secondary dimension and type in country.
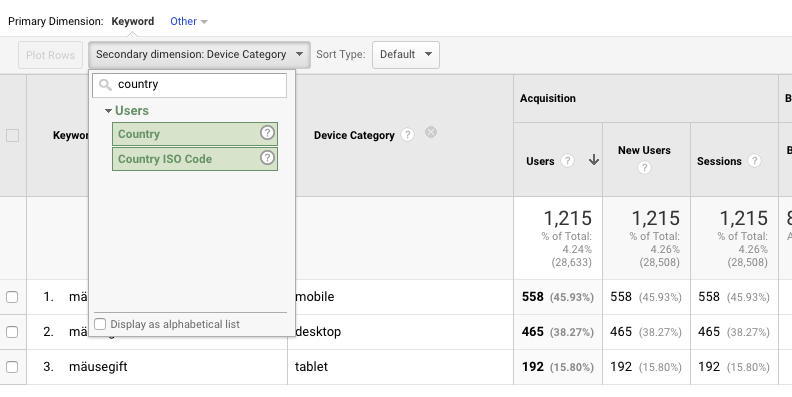
By seeing which nationalities use which keywords you can make smart decisions regarding the localization of either specific pages or your whole website.
Changing the Primary dimension
By default, your primary dimension will be set to Keyword when using Keyword Hero. But it is possible to change this.
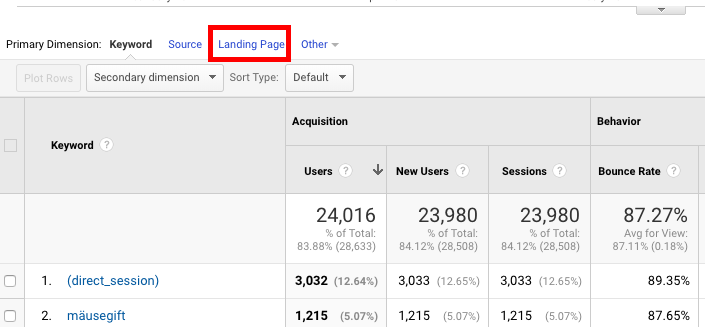
For example, if we set the primary dimension to Landing Page, and the secondary dimension to Keyword, we can see traffic by keyword per landing page. Let’s give this a try. First click on Landing Page next to primary dimension.
Next click on Secondary dimension and type in Keyword. Click Keyword to filter your data.
Analyzing these results helps us to understand how specific landing pages are performing at a keyword level.
By searching the results we can see how different groups of users behave on the same landing page. For example, if you click on a landing page you are interested in, then click on secondary dimension keyword we can see all the organic keywords that land on a specific page.
This enables us to compare metrics at a keyword level. If we notice that there is a high bounce rate for one keyword in particular, then we may need to see if the landing page is addressing the needs of these users. For example, if it is a product page and the product category does not match the search term, then you could optimize this by adding the queried product to the page and capitalizing on traffic.
Further Reading: Custom Metrics
Understanding your keyword data can help you understand user intent. This article offered an overview of secondary dimensions.
Keyword Hero offers special custom metrics that give you a level of insight not possible with Google Analytics.
Now you have learned the basics of secondary dimensions, check out how to use custom metrics here.