If you haven’t installed Keyword Hero yet, you can read this step-by-step tutorial.
After you’ve installed Keyword Hero, you’ll have to wait a bit.
Keyword Hero uploads your keyword data once a day, so it might take up to 24 hours for you to see anything in the Keyword Hero property.
Finding your Keyword Hero data
You find all keywords in your new Google Analytics property.
Keyword Hero automatically creates the new property in step 3 of your set-up process. It’s called “Keyword Hero property (GA4) – {NAME OF YOUR ORIGINAL PROPERTY}“.
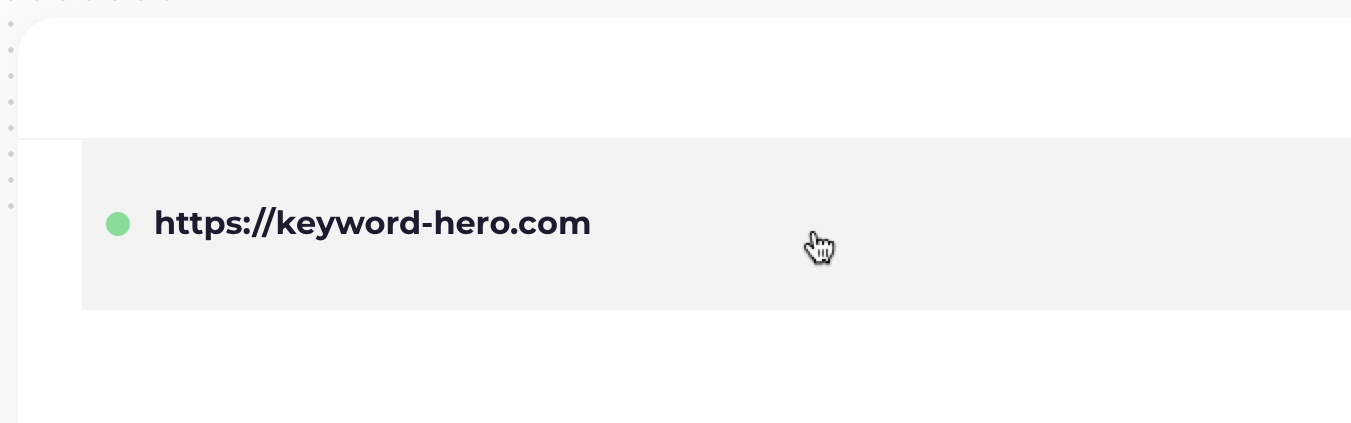
To go there, log into Keyword Hero and click on the bar that contains your domain:
After this, you will see an overview of your website’s performance for the last 30 days. This gives you a quick but powerful overview on which keywords are bringing in traffic, as well as which ones are converting. This article will cover the capabilities for Google Analytics.
To go to Google Analytics (or Looker Studio), click the three dots on the top right.
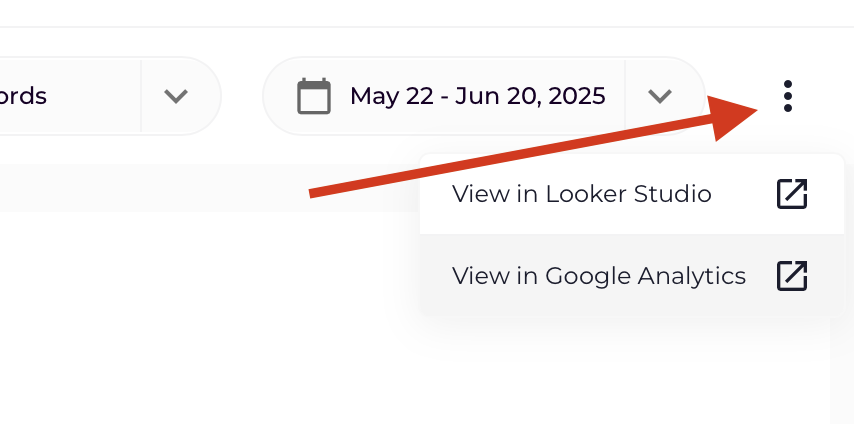
After clicking, you’ll land directly into the relevant Keyword Hero Property (in Google Analytics 4 or Looker Studio) with your organic keywords and performance data.
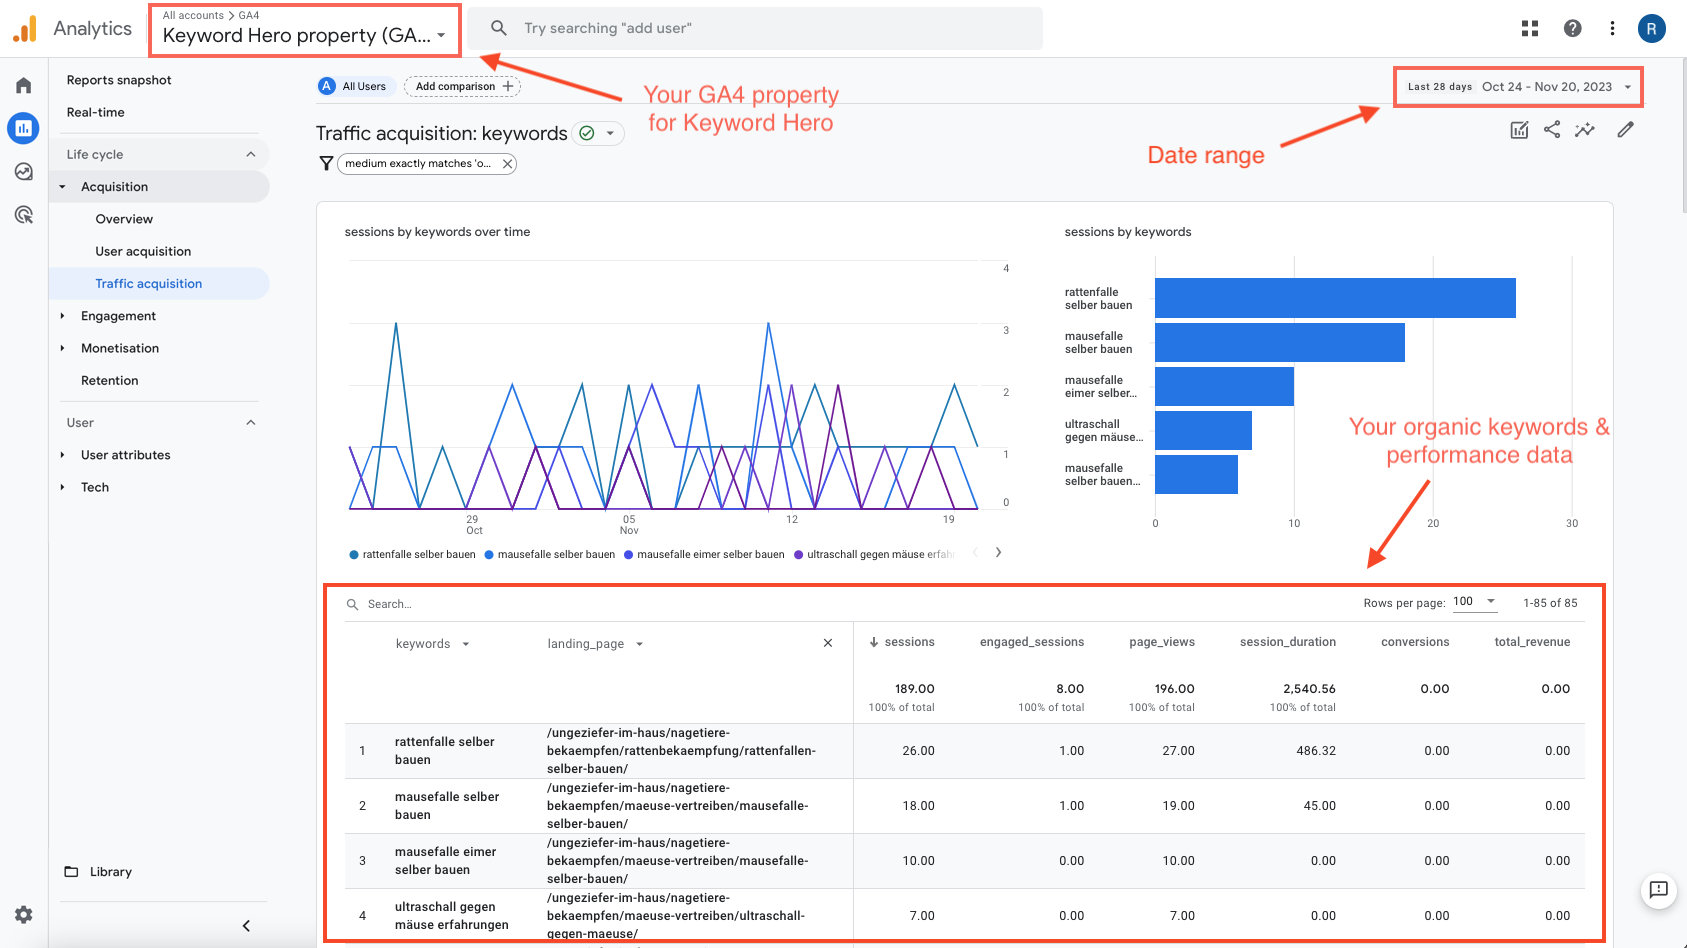
Example of the overview in Google Analytics:
Analyzing the data
Great, you’ve come this far!
Now it’s about making something out of the data.
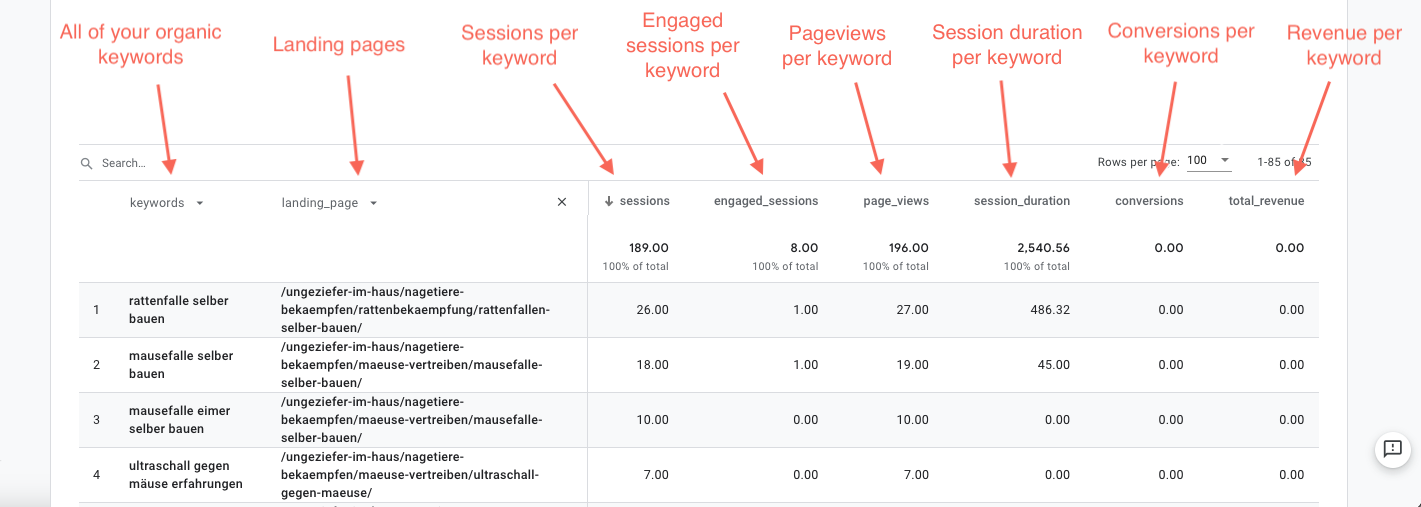
Your Keyword Hero Property provides visibility into all behavioral (e.g. sessions, engaged sessions, etc.) and transactional metrics (e.g. conversions, revenue) per keyword.
In the default report, we’ll show you real data in relation to keywords and landing pages along with the most important GA4 metrics.
On average, Keyword Hero will identify 93% of your keywords.
The match rate can vary per website with higher accuracy for larger sites.
You will also see a couple of other keywords in your keyword list, some of them are new.
(not set) = this is a tracking error or spam. Read about how to get rid of it here.
(not provided)_subdomain_add_searchconsole = traffic to a subdomain that you have not yet added to Keyword Hero.
(not provided)_bing = traffic from Bing.
(not provided)_yahoo = traffic from Yahoo.
(automatic matching) = AdWords.
Going deeper with secondary dimensions
You can refine your analysis and zoom into keyword performance across secondary dimensions including:
- landing_page: Any individual page from your website. We show this to you by default in the sample report.
- device_category: The device type that the user is visiting your site. It will usually be “web” or “mobile” and sometimes “tablet”.
- country_iso_code: The two-letter code for the country of the user who is on your website.
The fastest way to change the secondary dimension is to click on the current secondary dimension (e.g. landing_page) or, if there is none, to click on the + sign.
![]()
Next, type in the name of the dimension (e.g. device_category) by which you want to analyze the data and click on it.
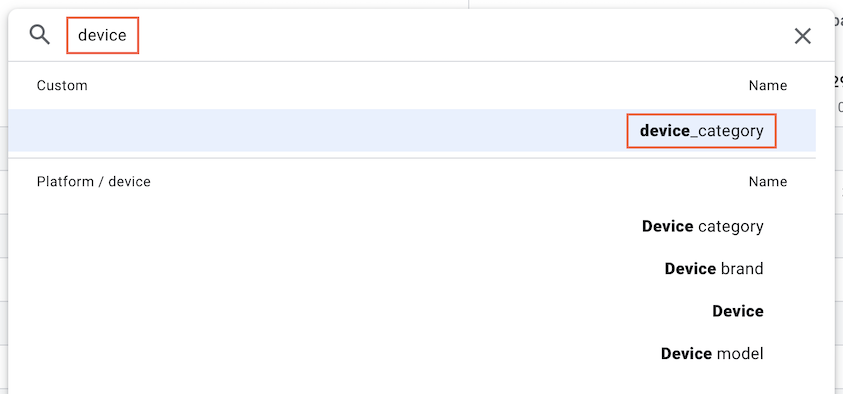
You’ll now be able to analyze keyword performance per device category or whichever dimension you chose).
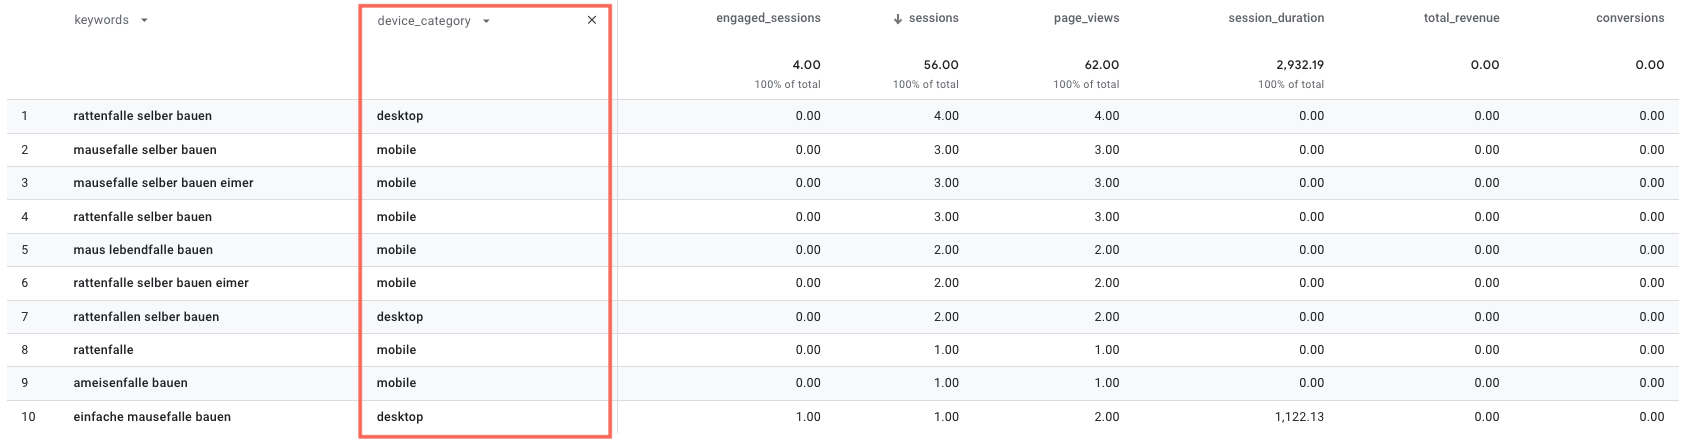
For a more granular view into your keyword performance data — whereby you can filter for individual keywords or dimensions, you can use the search field or setup filters.
Take advantage of new, custom dimensions
Keyword Hero also enables you to analyze the data by new, supplemental dimensions which can be very powerful.
We highly recommend that you check out:
- search_position_dimension: This is the position of your site in the SERPs. If you see a 1, you were the first listing on Google’s organic search results. Alternatively, 12, for example, would mean that your site was listed by Google in the 12th organic position.
- brand_classification: An automated brand detection, so that you can focus on your generic traffic or the branded traffic.
- date: As the data in your Keyword Hero property has a latency of 3 days, you can use this dimension to analyze data by the correct date.
You can analyze the performance of your website with these new custom dimensions in the same way that you would for the other secondary dimensions.
Just type in the appropriate name of the custom dimension, select it, and the report will update itself.
Create additional reports
Whenever you find a report template that you’d like to come back to, remember to save it into your library.
To do this, click on Save… button
And then select either:
- Save changes to current report; or
- Save as a new report
After this you can return to this report at any time and it will update automatically.
We recommend to save reports into your Library for all the types of analyses you might want to make on a regular basis:
- Keywords
- Landing Page
- Device Category
- Country
- Brand Classification
- Search Position
After you’ve set up the main templates, you can setup additional reports in your library that hone even further into different performance views of your organic traffic.