This article walks you through the necessary steps to show the average position of specific keywords in a time series chart.
Monitor a single keyword
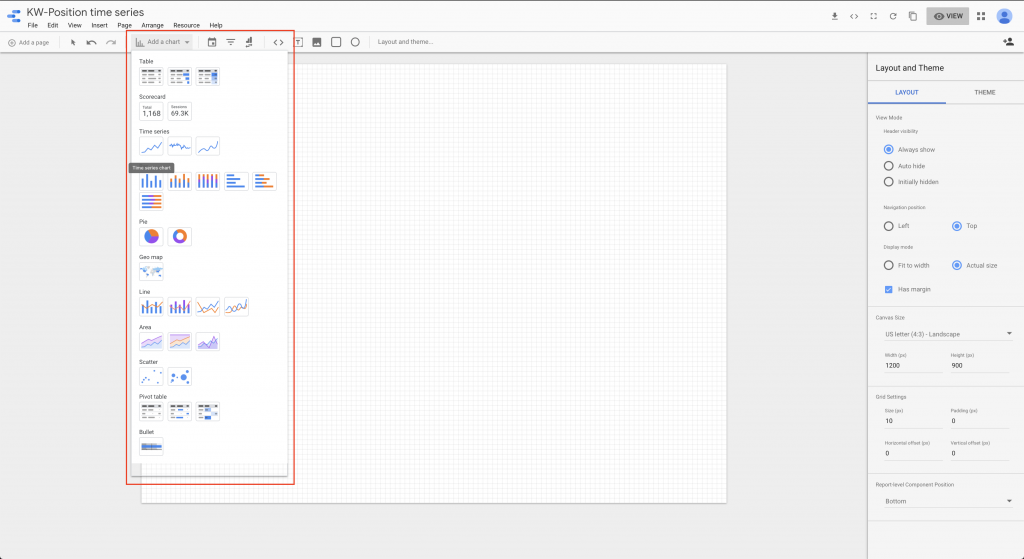
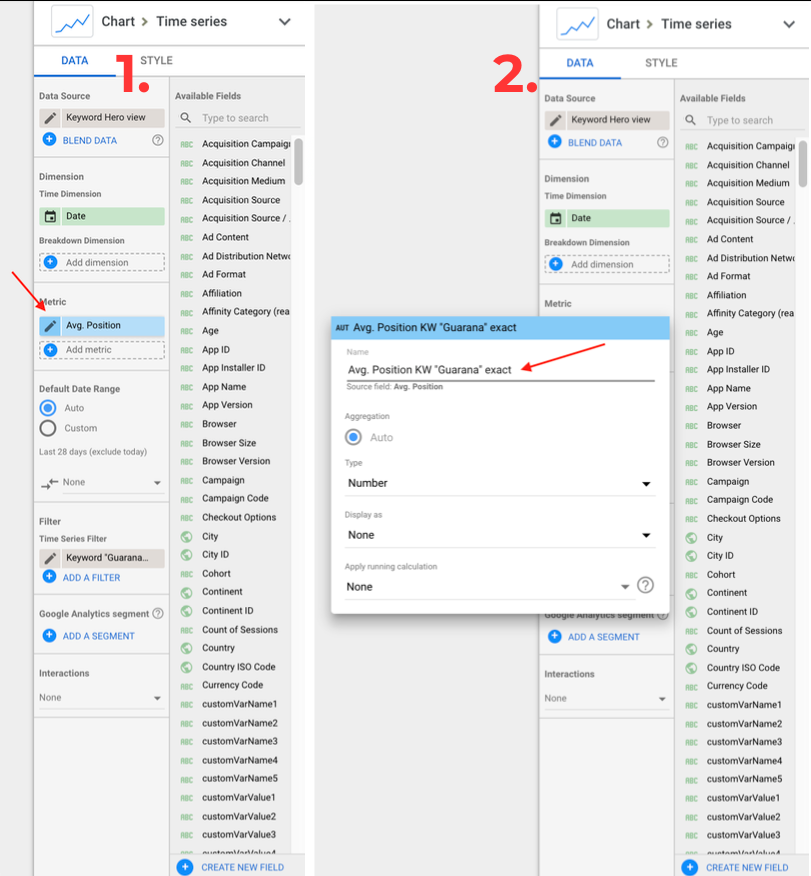
- Add a time series chart
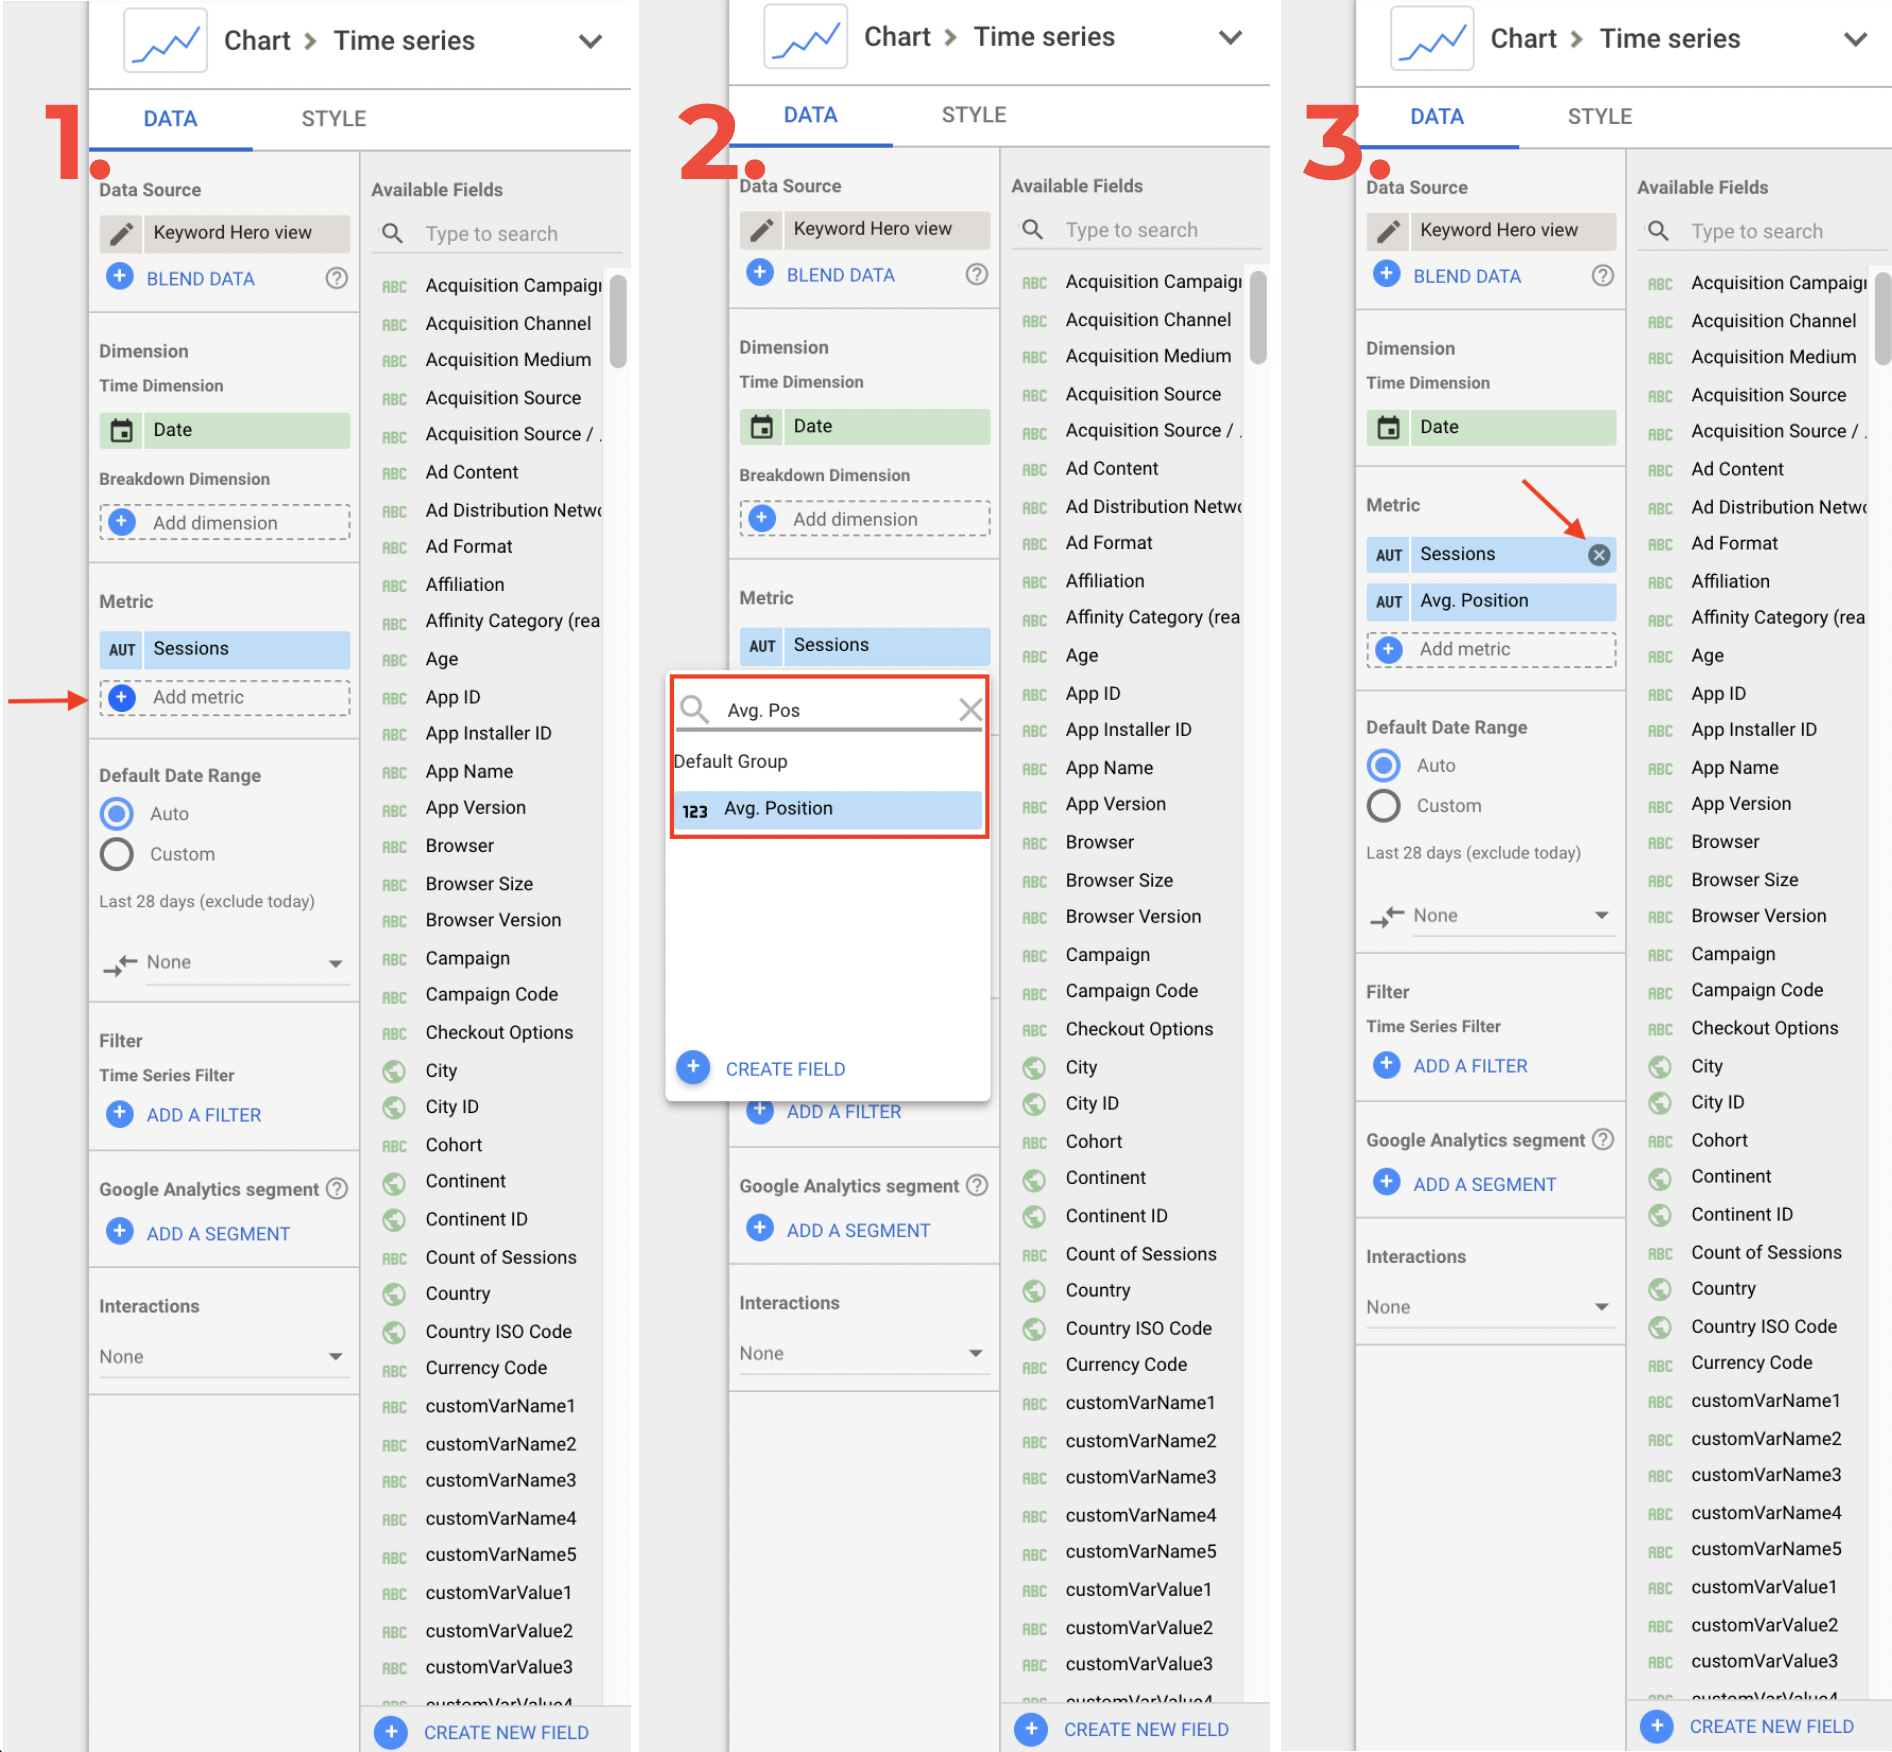
- Select the “Avg. Position” metric and delete the “Session” metric
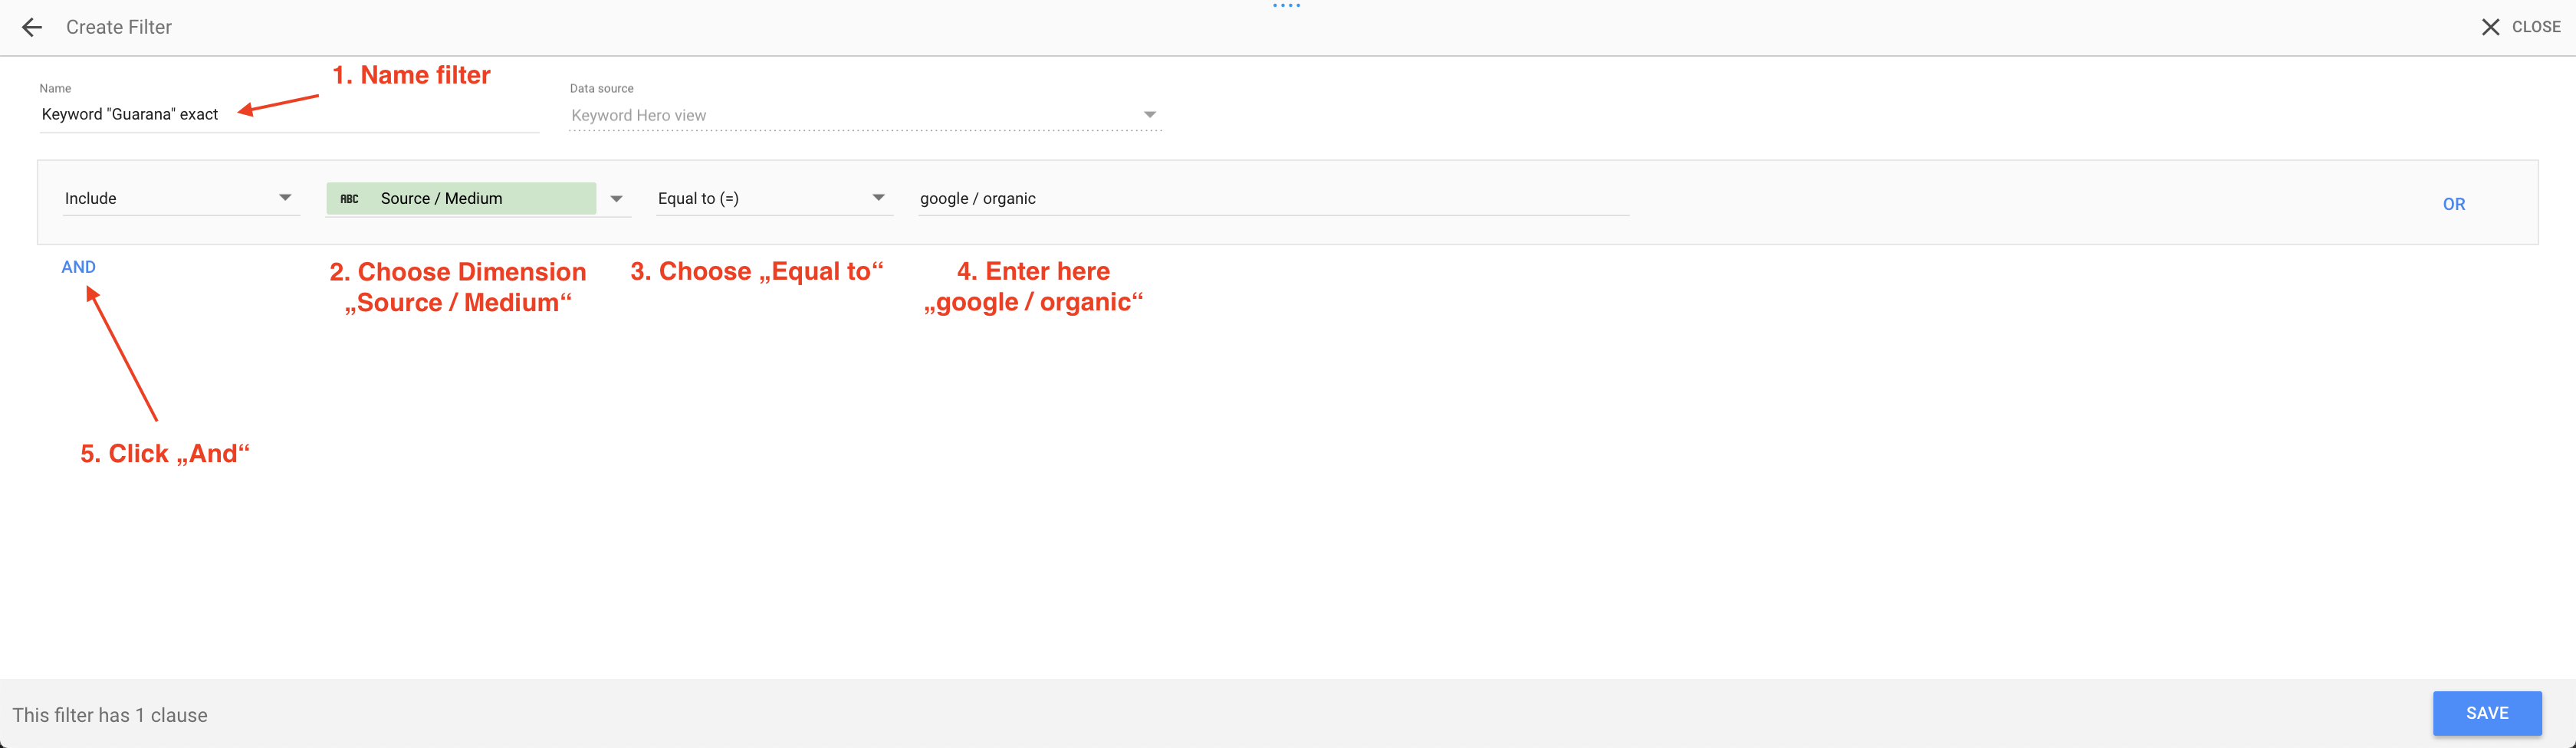
- Now you have to add a Source/Medium filter and a filter for the specific keyword
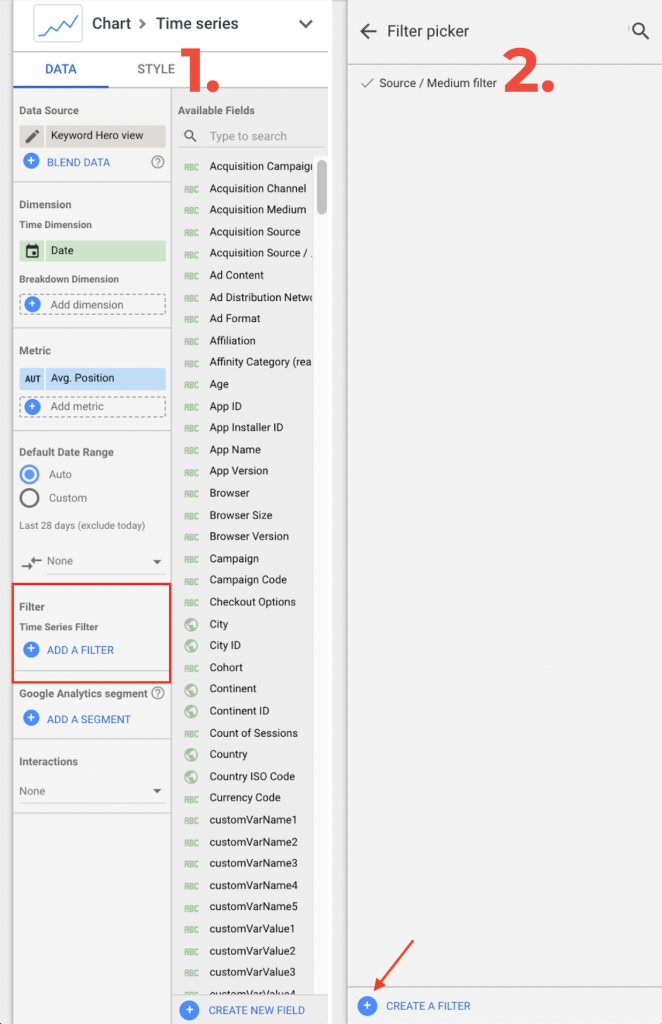
Source/Medium filter
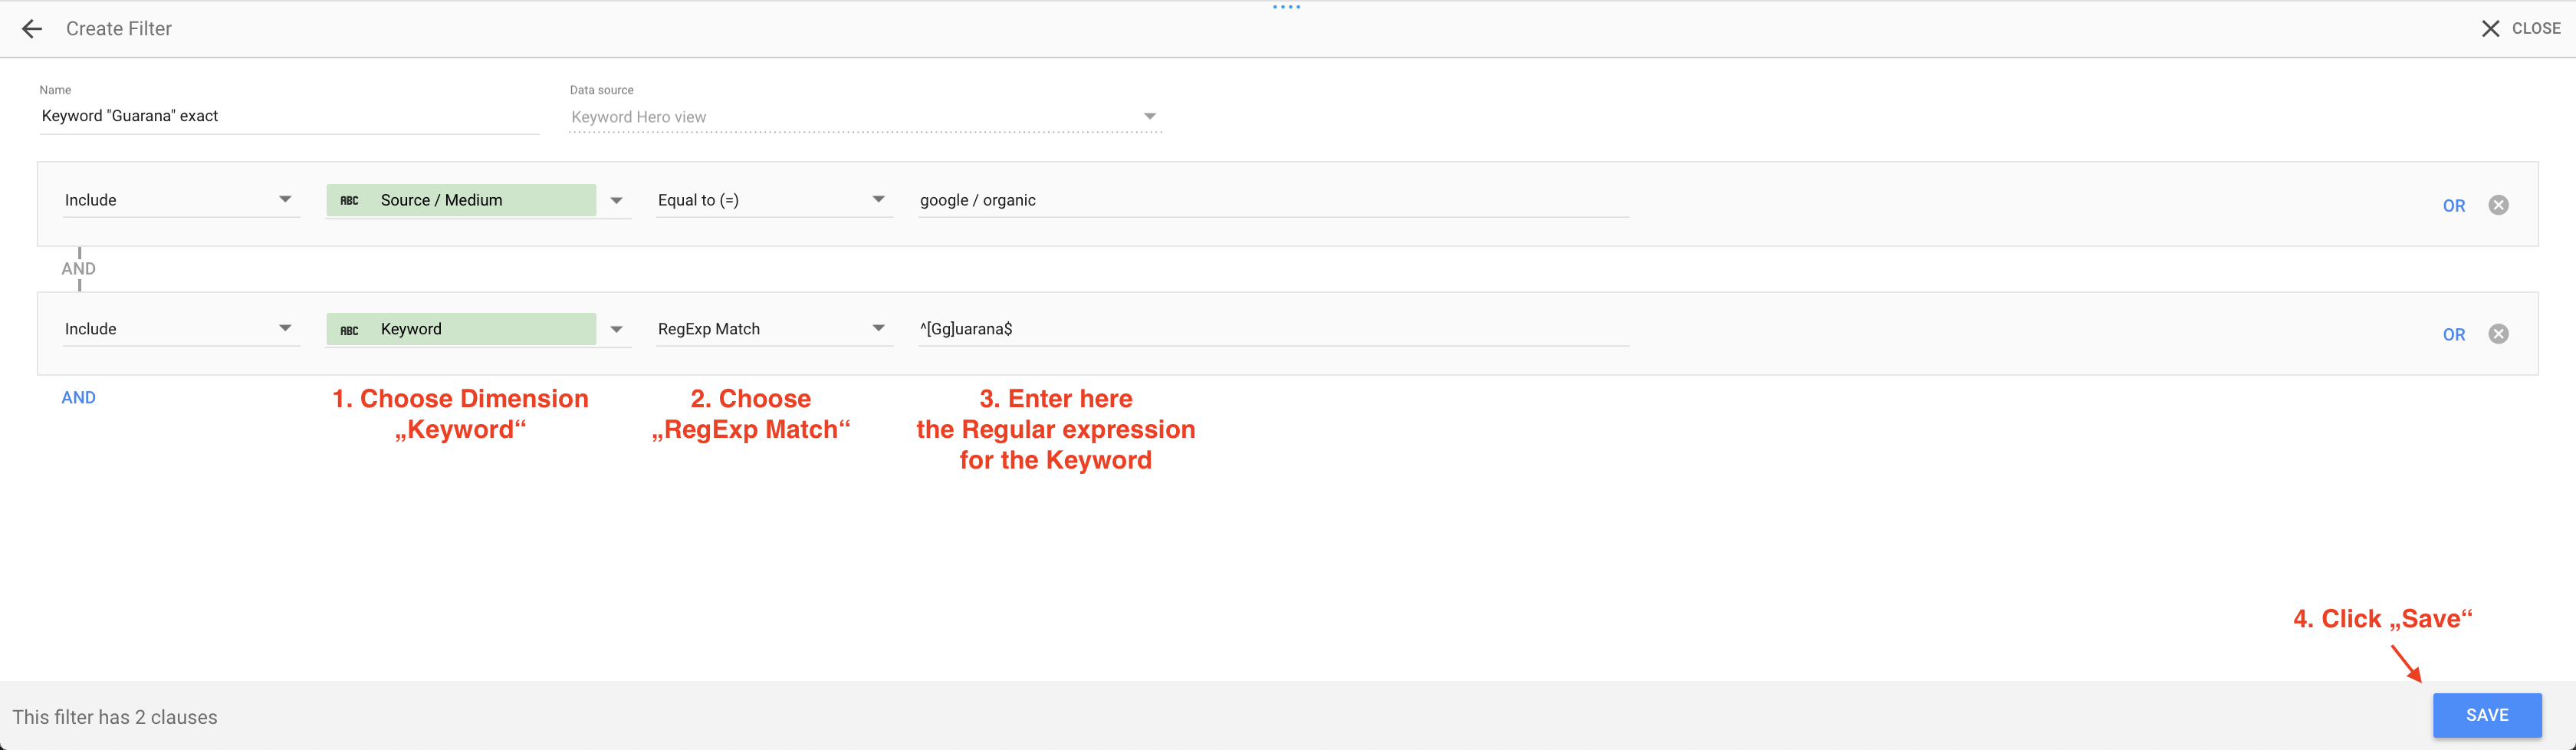
Keyword filter
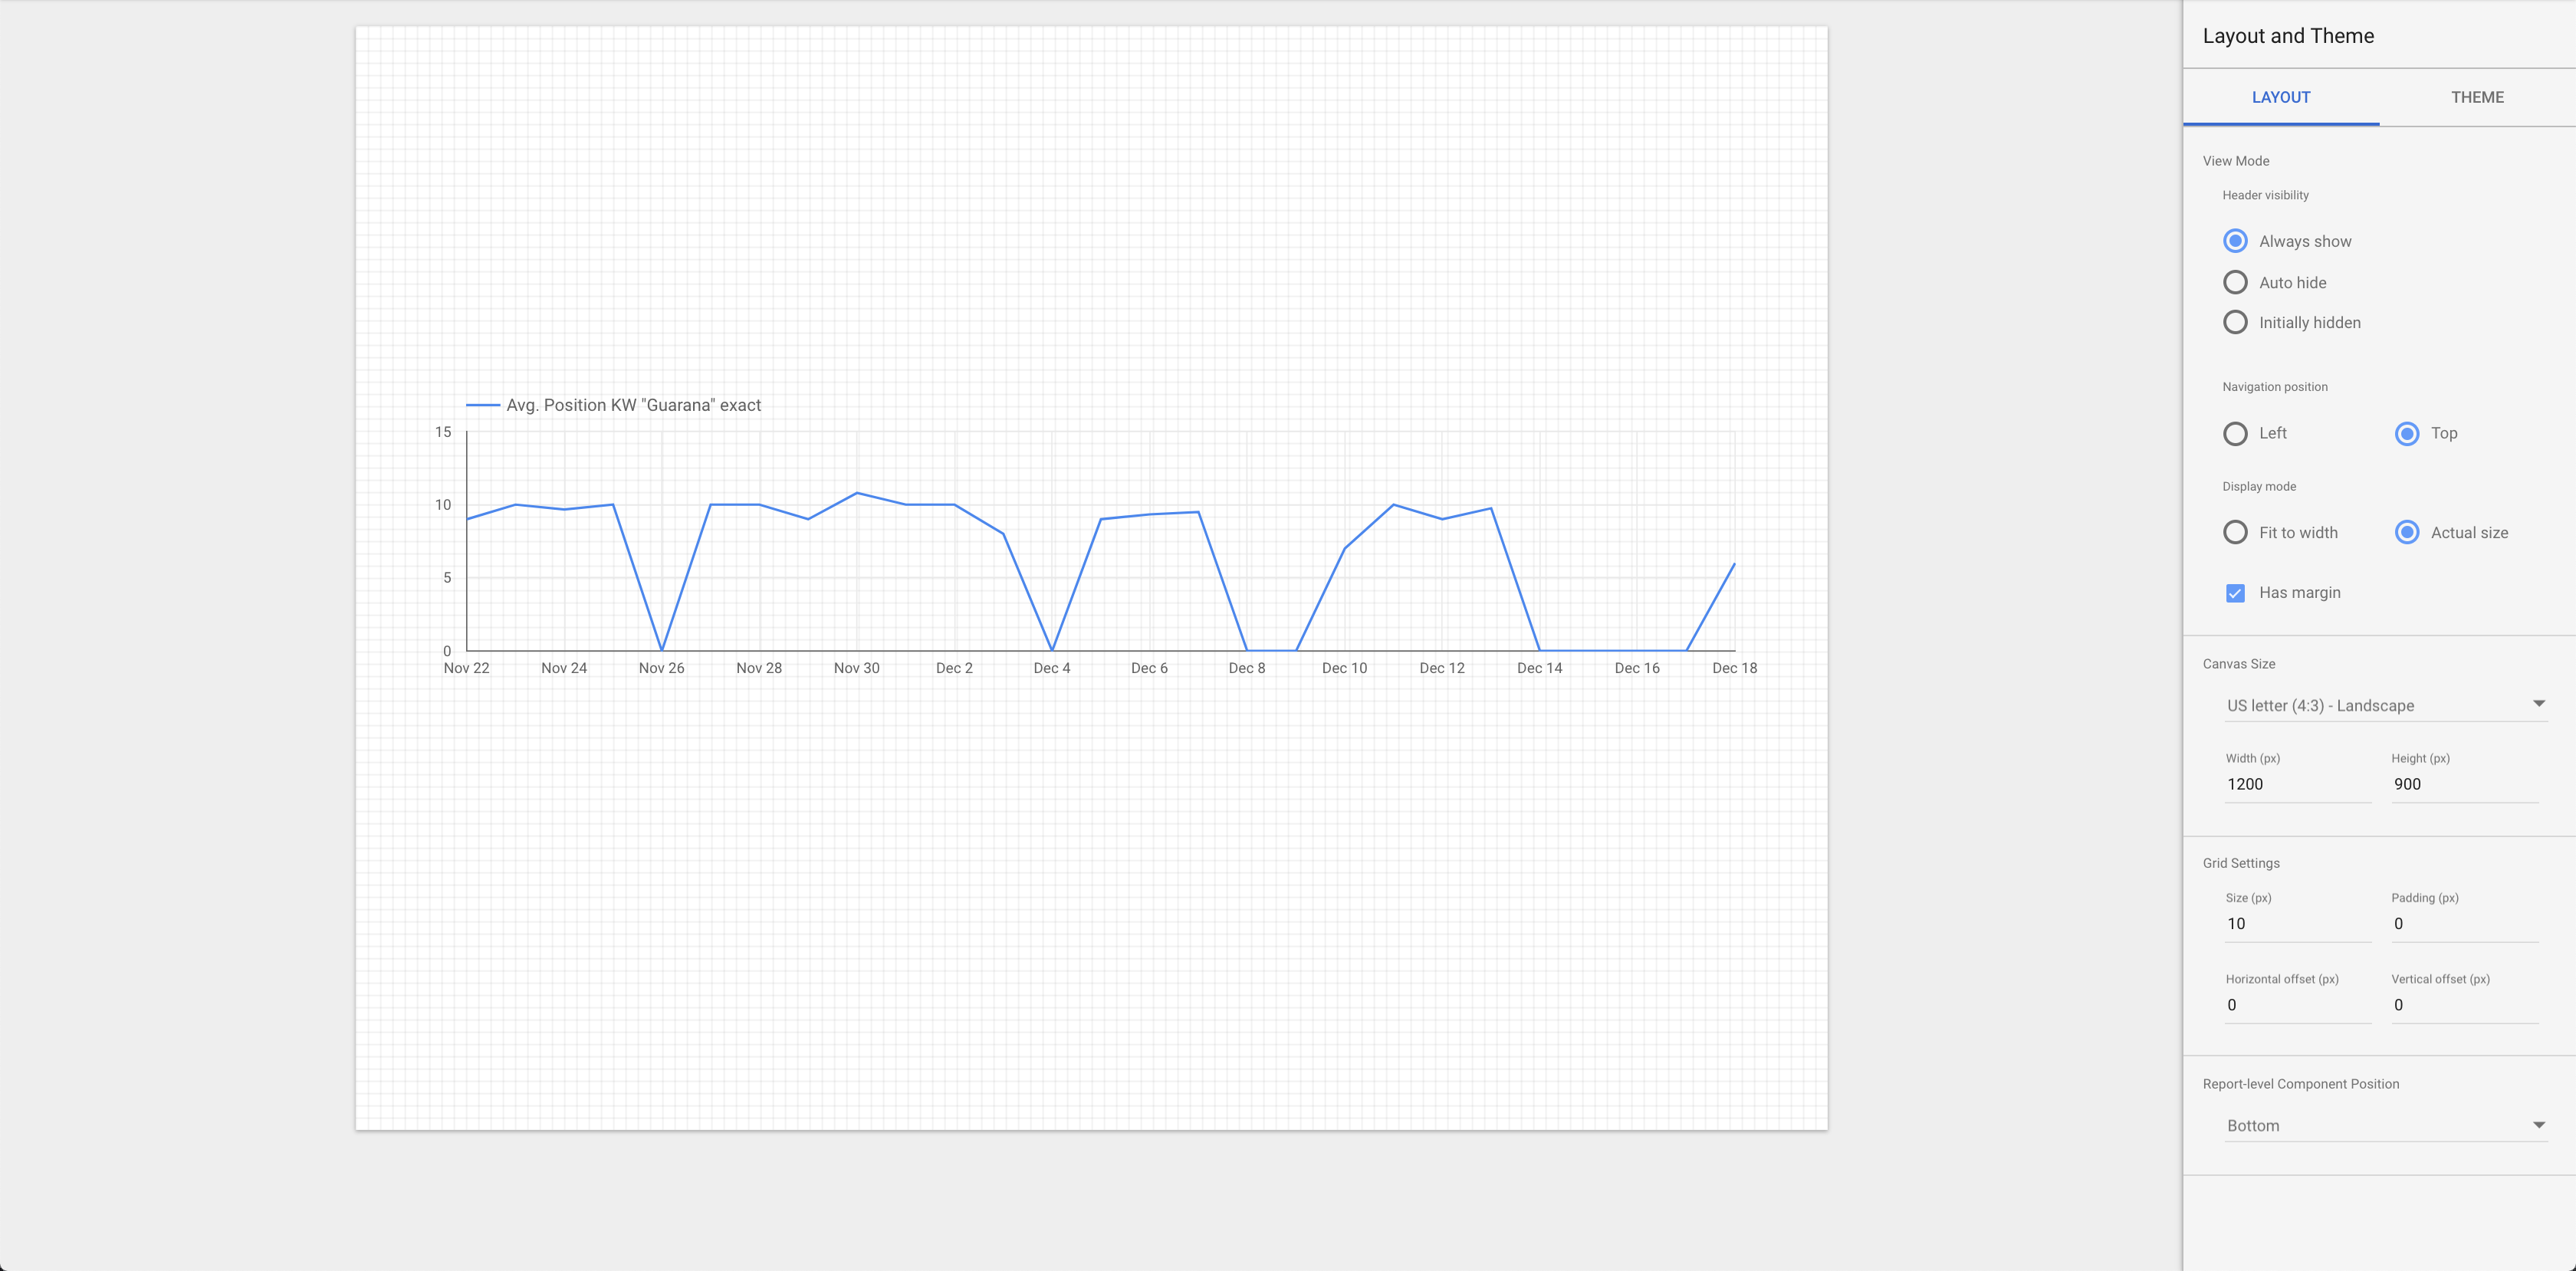
- Now you can rename the metric “Avg. Position” according to your specific keyword.
All done!