The goal of any SEO effort should always be to acquire users that behave in ways that align with your company’s business goals, whether it’s a conversion such as a purchase for e-commerce companies or pages per visit for publishers.
Optimizing for traffic only is almost certainly not going to deliver great results.
Understanding which exact keywords are driving sales and conversions is especially important in highly competitive environments.
Ever since 2011, this has become impossible until the Keyword Hero came along.
You can now identify the organic keywords that generate the most conversions and revenue.
Find your best-performing keywords
Finding the keywords that result in the most conversions is probably one of the most interesting pieces of information for marketers.
To see which of your organic keywords drive results, log into Keyword Hero and click on the domain that you want to analyze.

Then, scroll down to click “View in Google Analytics”.
Then remove the landing_page dimension by clicking on the (x) next to it.
![]()
Next, click on the “conversions” dimension at the top of the column. The arrow will point down and the data will show in descending order.
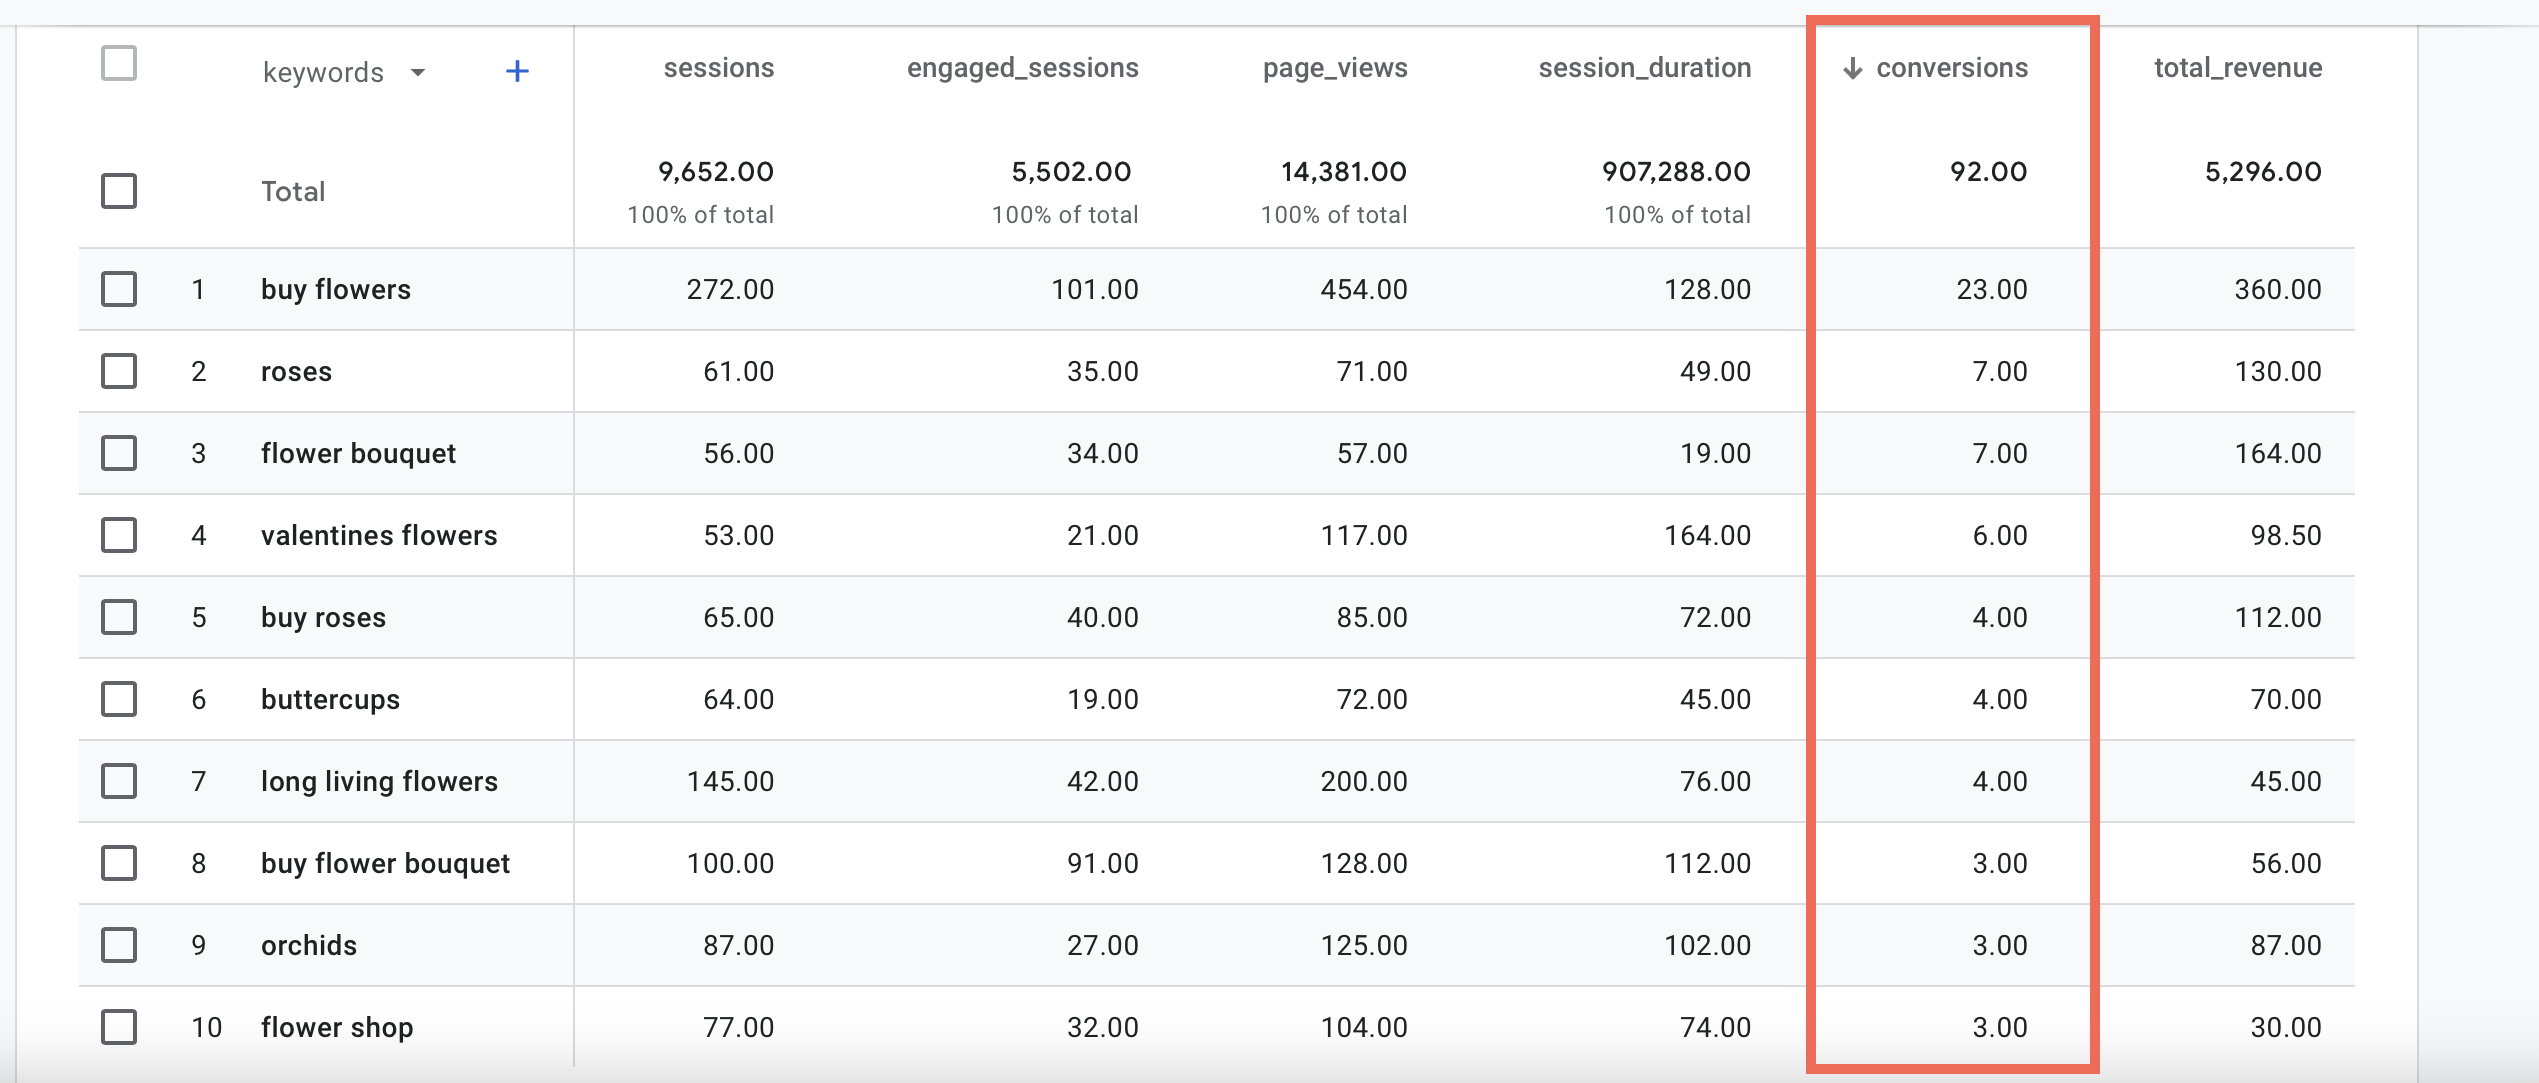
You can similarly analyze the data in terms of revenue.
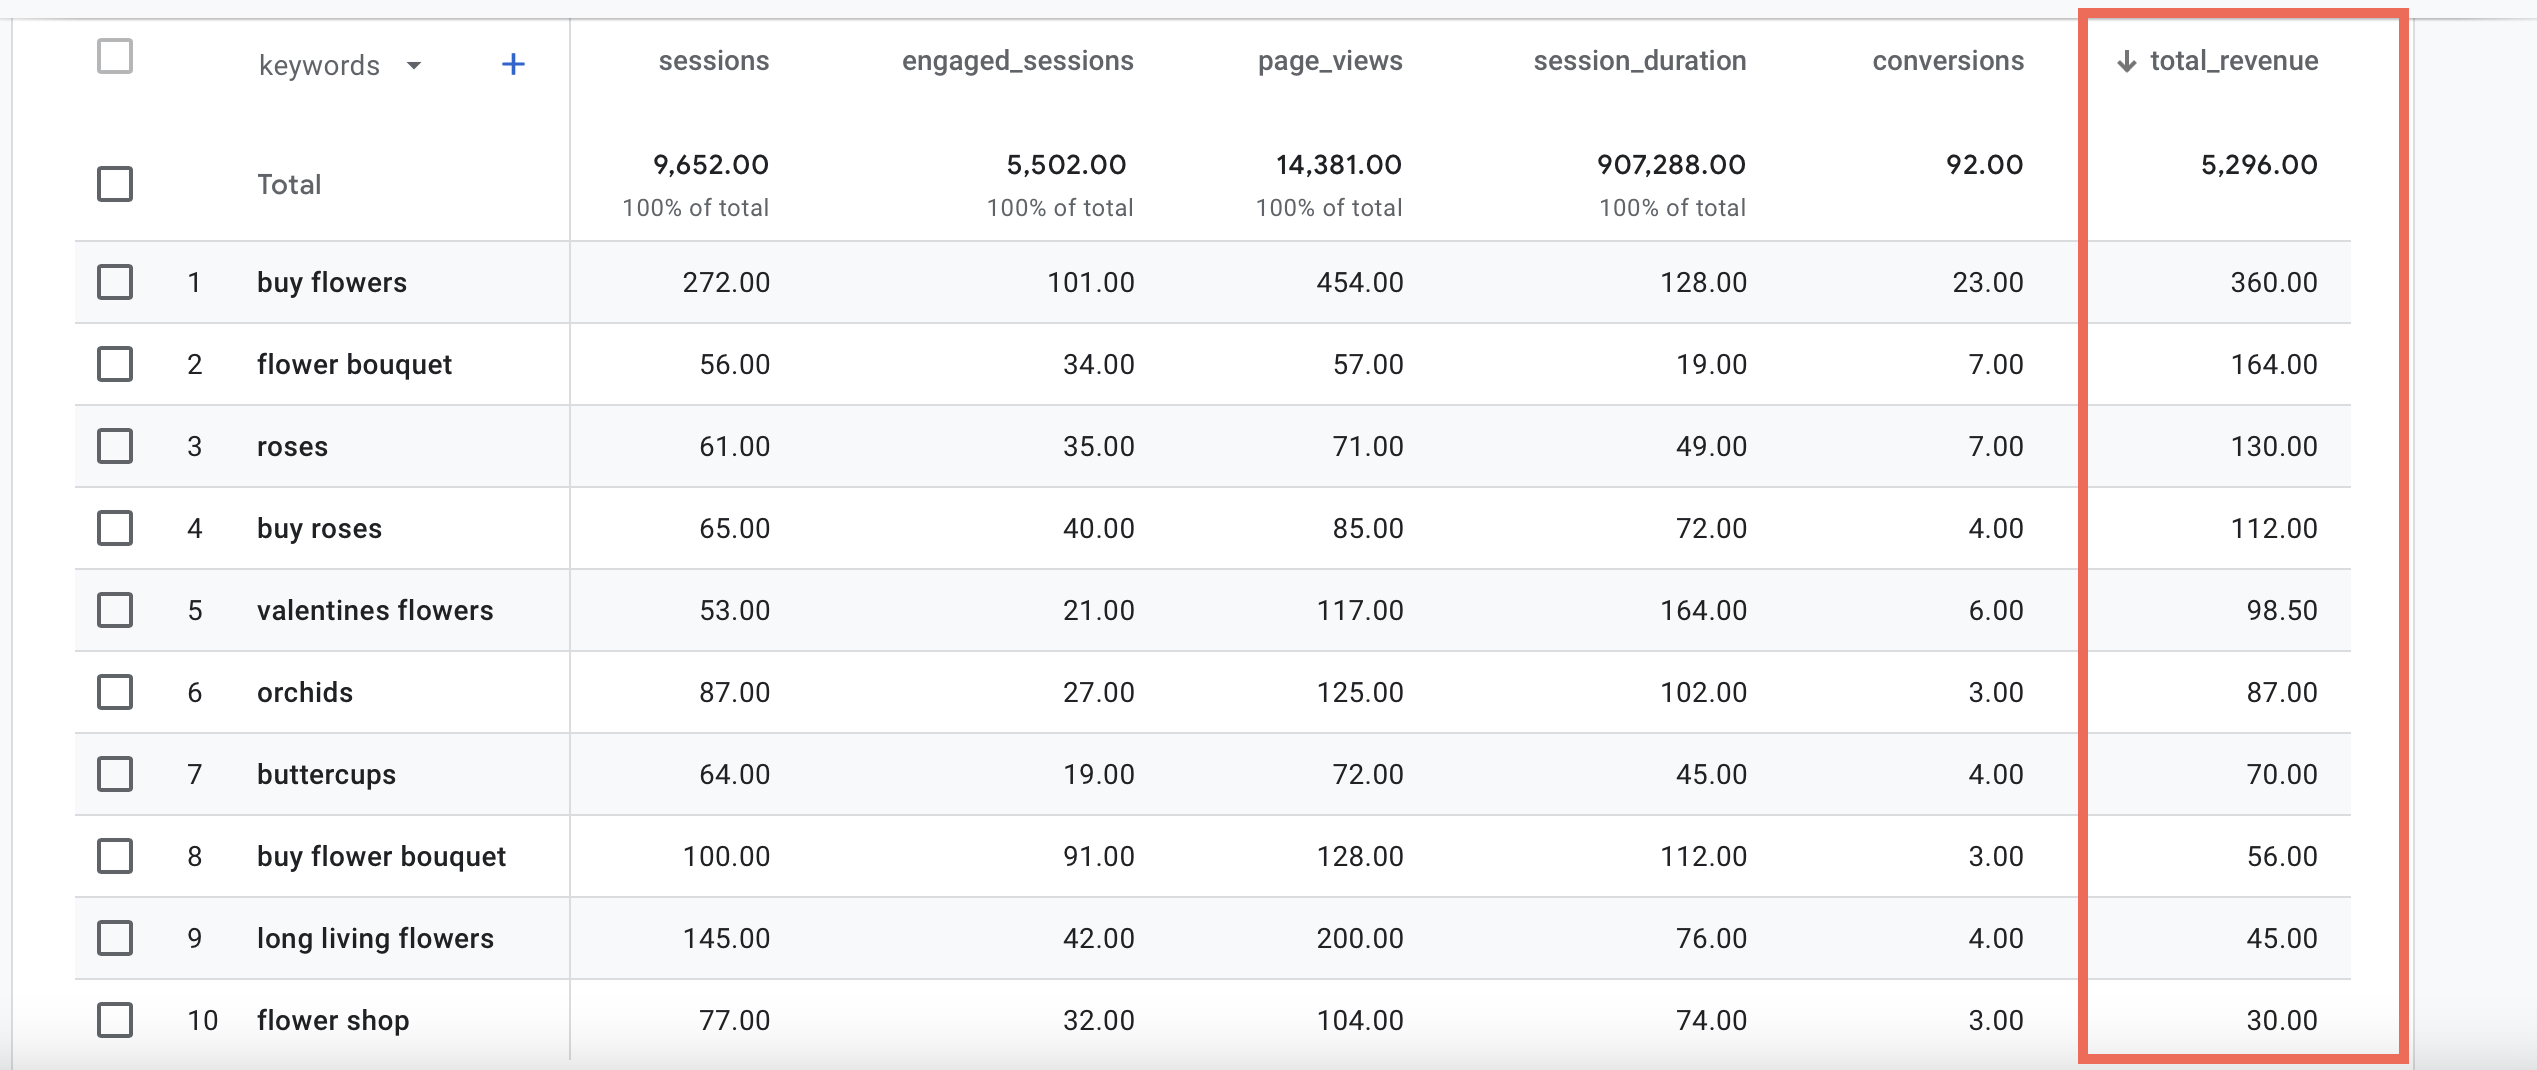
Let’s take a look at the example below.
The keyword that results in the most sales is “buy flowers”, which is also a keyword that is responsible for a large amount of traffic.
Another interesting fact is that both phrases “flower bouquet” and “roses” are surprisingly often found among the highest converting keywords.
They also come with significantly increased conversion rate compared to those search phrases connected to the more generic term “flowers”.
Having access to your data will unlock your ability to make the best decisions for your business.
Analyzing individual LPs
In the first step, we looked at all URLs on our website.
Now, we go a bit deeper into our analysis and look at the LP, “/roses”, which is one of our top revenue landing pages.
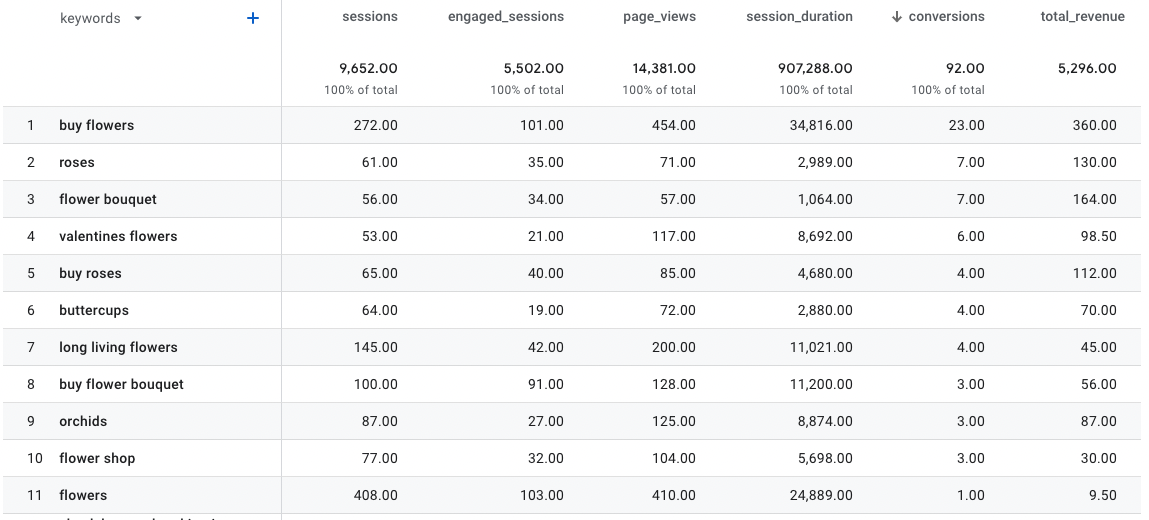
First, make sure that the primary dimension is “keywords” and the secondary dimension is “landing_page” or vice-versa.
![]()
Please note that the report is pre-configured to show data this way only when you click on the View Analytics button from your Keyword Hero dashboard.
If you want to isolate the landing pages to only show one landing page (e.g. /roses), you’ll need to adjust the filters:
- medium = “organic”
- source = “google”
- landing_page = the individual landing page that you want to analyze
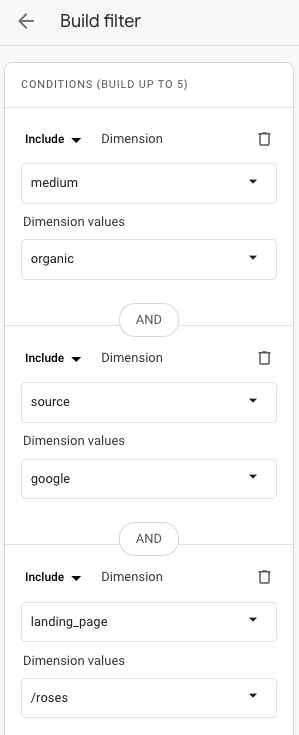
Remember to click the “Apply” button once you change the filters.
Next, sort the data based on “conversions”.
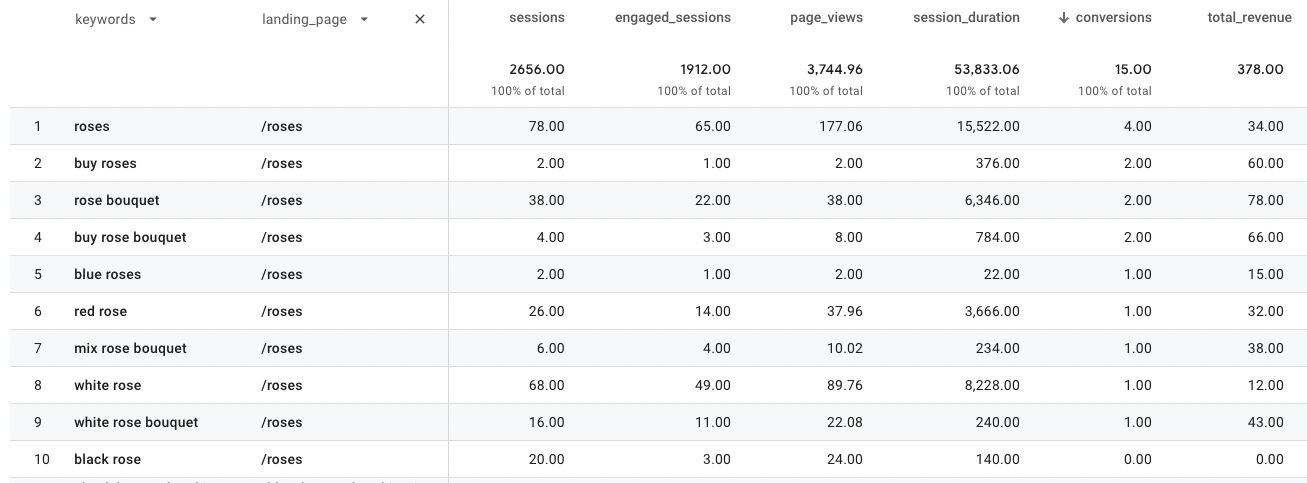
The keyword that results in the most conversions for this site is “roses”, closely followed by “buy roses”.
Whereas “roses” is responsible for 78 sessions, the query “buy roses” only generated 2 sessions.
Both keywords resulted in conversions.
In a later step, we’ll uncover why we only had two sessions with this keyword, “buy roses”.
At a first glance at the data, we notice two very interesting insights, that can also give us hints about how to optimize this URL.
Insight #1. The power of transactional queries
Transactional search phrases that contain “buy” seem to result in significantly increased conversion rates compared to search phrases that are only informational (or at least not as obviously transactional): of the nine keywords that resulted in sales, two contained the “buy”.
We export the data in Google Sheets or Excel, where we can conduct further analysis and separate all queries that resulted in a session on /roses into “transactional” and “informational” ones (the third large type are “navigational” queries but none occurred on our site):
![]()
Transactional queries result in vastly increased conversion rates compared to informational queries, in this case way more than expected.
In this example, it would be very profitable to focus the SEO efforts on transactional queries.
Insight #2. Bouquets over single flowers
The second important thing we notice is that the phrase “bouquet” is very prevalent among our queries, and comes with a slightly better conversion rate, and a surprisingly higher order value.
Once again we use Google Sheets or Excel to get a clearer image of the data:
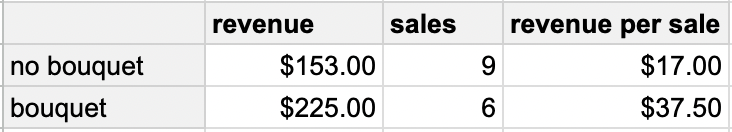
Users that already know that they are looking for a flower bouquet, spend more than twice as much as those who don’t use that phrase(!).
Equipped with this information, we would optimize our site for more revenue by catering more to those users that are explicitly looking for “bouquets”.
This will result in more of this valuable traffic and in even higher conversion rates.
You can perform this type of detailed analysis on all of your web pages and folders.
By analyzing and optimizing each page, your site will increasingly generate higher engagement, conversions, and revenue.
Using different metrics
If there is too little conversion data available, this type of analysis may not possible.
In this case, you need to use different metrics:
Transaction-related metrics
Consider analyzing your keywords with an Event that takes place earlier in the conversion funnel.
For example, instead of looking at sales, you might want to look at how many users “added to cart” or another type of Event that still relates with an online purchase.
In most cases, optimizing your website for this type of goal will result in a ton more data and makes it much easier to make optimization decisions.
Behavioral metrics
If there aren’t yet enough users on your site to analyze keyword performance based on a transactional goal you can instead analyze on-site performance in terms of behavioral metrics such as engagement rate or average session duration.
These metrics will often correlate with the Goals and Conversion Events that matter most to and can deliver valuable insights about whether your users seem to find what they search for on you website.
Even a little data is enough to recognize trends in individual keywords and optimize your site accordingly.
Simply export the data from Google Analytics and import into Google Sheets or Excel to calculate the relevant metrics.